
How to Calculate Pivot Points in Forex Trading

![]()
What is Pivot Point in Forex Trading?
Firstly pivot point Indicators is a technical indicator that forex traders use to predict probable future market moves. The pivot point forex indicator is used to assess trend bias as well as levels of support and resistance. Which may then utilized to establish profit objectives, stop losses, entry and exit points.
Pivot Points Calculated in The Following Manner
Pivot Point Calculation Formula
The following is the calculation for the most basic type of pivot point in forex Trading known as ‘floor-trader pivots,’ as well as their support and resistance levels:
Pivot Point Trading Strategy Formula So It willbe Easy for you to Understand
Pivot point (PP) = (High + Low + Close) / 3
First resistance (R1) = (2 x PP) – Low and First support (S1) = (2 x PP) – High
Second resistance (R2) = PP + (High – Low) and Second support (S2) = PP – (High – Low)
Third resistance (R3) = High + 2 (PP – Low) and Third support (S3) = Low – 2 (High – PP)
There are several methods for calculating the pivot point using pivot Point Indicators. Which are available on most trading platforms. Also extended across many time frames. Like above-mentioned support and resistance levels will be computed.
The following is an example for you of what is available for daily pivots on the IG trading platform. The same pivot trading formula used to calculate weekly or monthly pivots.
Example for Pivot Points Indicators Trading Secrets
Assume that you wish to compute the pivot points for a stock based on the previous day’s trading values, which were High price = $150, Low price = $100 and Close price = $120:
Your findings will be shown immediately, as given below.
R3 = $196.67; R2 = $173.33; R1 = $146.67; PP = $123.33; S1 = $96.67; S2 = $73.33; and S3 = $46.67.
How to Calculate Pivot Points in Forex Trading
When the forex pivot point indicator is applied to a chart, the levels are computed and shown automatically. Here’s how to calculate them yourself, bearing in mind that pivot points are mostly utilized by day traders and are based on the previous trading day’s high, low, and close.
If it is Wednesday morning, utilize Tuesday’s high, low, and close to determine the pivot point levels for the trading day on Wednesday.
Find the day’s high and low, as well as the close from the previous trading day, after the market closes or before it starts the next day.
Add the high, low, and near values together and divide by three.
Make a note of this price on the chart as P.
Calculate S1, S2, R1, and R2 after P is known. In these calculations, the high and low are from the previous trading day.
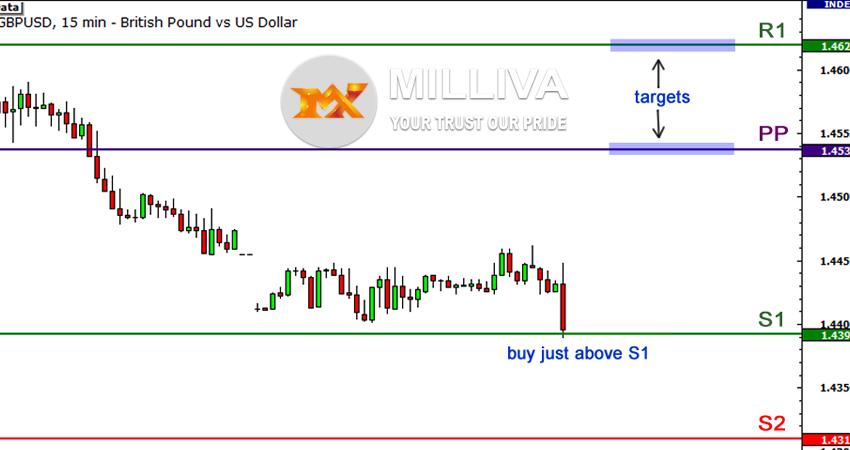
Pivot Points Indicator in Forex Trading: How to Apply Them
Forex traders employ Pivot Points in conjunction with classic support and resistance trading tactics. Price, like support and resistance, tends to obey these levels. The price levels of pivot points are evaluated on a regular basis, which further validates these levels.
In the forex market, traders typically employ additional validation tools such as indicators, candlestick patterns, oscillators, fundamentals, and price movement in combination with the pivot to make trade choices.
Few Essential Rules to Remember
Price above pivot indicates a bullish tendency.
Price below pivot indicates a bearish tendency.
Because of the larger data collection, longer period pivot points are more reliable.
Support and resistance levels are pivot extensions that may be utilized as additional significant price levels.

Visit us : www.milliva.com