How to Trade Forex Using the Bat Candlestick Pattern

![]()
What is Bat Pattern?
Scott Carney created the bat pattern, which is a harmonic trading pattern. In his Harmonic Trading series of books, he discussed the pattern.
It’s one of numerous harmonic trading patterns that combines pattern recognition and Fibonacci analysis to provide a trader a rule-based system. The Gartley, Butterfly, and Crab patterns are a few additional prominent harmonic patterns in forex. In terms of general pattern structure, the Gartley pattern is the most comparable to the this. In the following part, we’ll compare and contrast the Bat and Gartley patterns.
This pattern is a five-point chart pattern that generally signals a market reversal. It strongly relies on Fibonacci ratios to appear at various places throughout the construction. These are rather tight specification.
This pattern has a deep retracement against the prior price move, and often resembles the shape of the letter M in the case of a Bullish Bat formation, and in the instance of a Bearish Bat formation, the shape of the letter W. We’ll define each of these important relationships shortly, but for now, it’s important to understand that this pattern has a deep retracement against the prior price move, and often resembles the shape of the letter M in the case of a.
The Bat Pattern Identification Rules
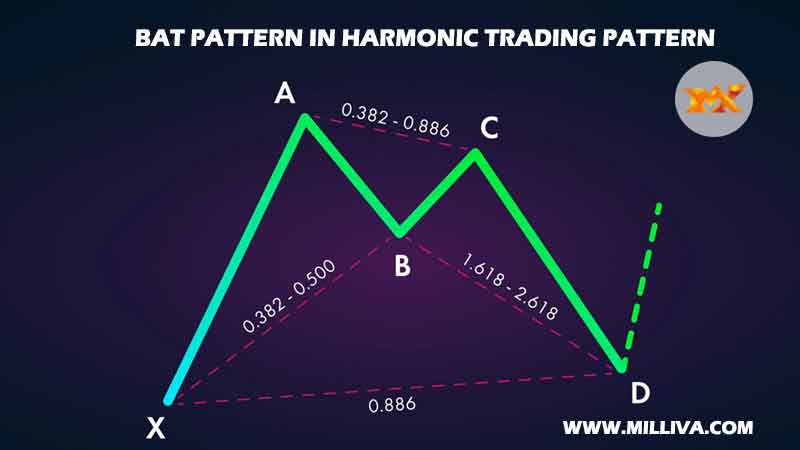
The Bat pattern is a five-point design with highly strict Fibonacci connections, as previously stated. An example of the construction of the bat pattern may be found below:
So, this is how we make the harmonic bat pattern. To begin, take note of the five points that make up the bat design.
Within the overall framework, these five points make up the individual legs. The XA leg, the AB leg, the BC leg, and the CD leg are the labels for these legs.
As a result, whenever we refer to a certain swing inside the this pattern, we refer to one of these specific legs.
Let’s Look at Each of These Four Legs Inside the Bat Anatomy in More Detail
The XA leg is the first movement inside the structure. It’s usually an impulsive leg with a large price change. The kick-off of the pattern is this leg, which is the longest within the entire structure. The initial retracement that happens against the XA leg is known as the AB leg. This retracement is frequently the Fibonacci 38 percent retracement, or 50% of the XA leg.
The BC leg goes in the same direction as the XA leg, but it must stay inside the bounds of point A. Within the range of 38 to 88 percent, the BC leg retraces the previous AB leg.
The CD leg is the last leg of the Bat structure and the most important section of the pattern in terms of Fibonacci calculations. The CD leg should retrace 88 percent of the XA leg. Point D should also indicate a 161% or 261 percent extension of the BC leg, but this is less relevant.
The following are the main guidelines for identifying this pattern on the chart. It helps to conduct these measurements manually with the different Fibonacci tools when you’re first learning how to recognize and name so that you can get intimately aware with the laws underlying them.
However, you’ll eventually want to use a charting software with harmonic pattern detection algorithms. You can at the very least use a harmonic trading indicator. This will allow you to identify much more quickly and efficiently.
Pattern of a Bullish Bat
The Bat pattern may be either bullish or bearish in nature. We’ll start by looking at the bullish bat harmonic pattern in more detail.

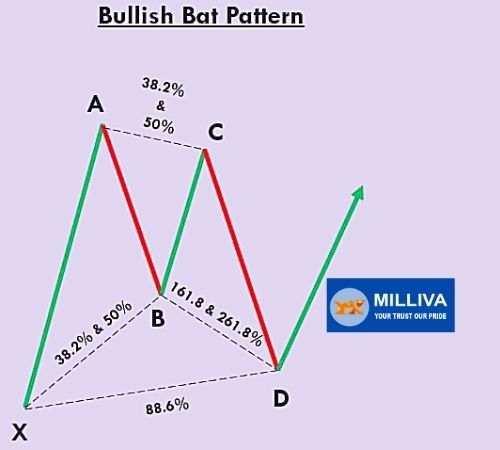
An Illustration of the Pattern and its Fibonacci Ratios May be Found Below
The initial XA leg is bullish in the above picture of the bullish bat pattern, and it kicks off the whole pattern. Following that, we should expect the AB leg to retrace the XA leg by 38 or 50%. The B point is the moment at which this retracement comes to an end. And the Fibonacci ratio observed at the B point is crucial to the overall structure of the Bat.
Following the establishment of the B point, we should expect prices to rise in the BC leg. The BC leg will normally retrace the AB leg between 38 and 88 percent of the time. Finally, near the end of point C, the price action within the CD leg will continue to go lower. The Bat pattern comes to a close at the D point of the CD leg. Price should end at or near the 88 percent retracement level, completing the harmonic bat formation and exerting positive pressure on future price movement.
Pattern of a Bearish Bat
The bearish Bat pattern has the inverse meaning of the bullish Bat pattern. Let’s look at how the bearish Bat pattern looks, as well as the price fluctuations within each of its legs.

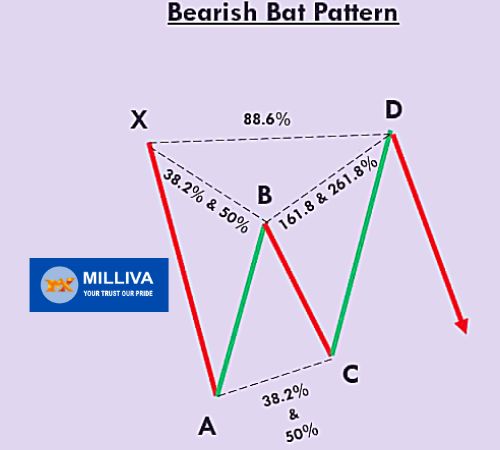
The Bearish Version and Accompanying Fib Ratios for the Bat Pattern are Shown Here
The initial XA leg in a bearish Bat pattern will be bearish. The AB leg will retrace the XA leg by a Fibonacci ratio of 38 percent or 50 percent higher. This is the B point of the bearish Bat pattern once more. The B point has a unique meaning inside the bat structure, and it must end at one of these two levels in order for the structure to be accurately labelled as a bat.
A deeper retracement at the B point, as we’ll see later, can invalidate this pattern and lead to it being classified as a Gartley instead. The BC leg will then follow, retracing 38 to 88 percent of the previous AB leg. Finally, the structure’s last leg, the CD leg, will rise and end around or near the 88 percent retracement of the original XA leg. Once this occurs, the bearish Bat structure is confirmed, indicating an impending reversal as prices should begin the trade lower.

Visit us on: www.milliva.com


Bearish Crab Pattern in Harmonic Trading
06th Jul 2022[…] pattern did not quite rise to 161.8 percent of the XA leg in this case. When determining whether a harmonic pattern is genuine or not, some subjectivity is […]