Candlesticks In Forex
![]()
Candlestick charts are the most popular price charts in the financial markets because they provide a clean and attractive way to represent price movements. Candlestick charts have several advantages compared to other chart types, which will be described in the following lines. Additionally, we will explain what candlesticks are, how they are formed, the best way to study candlesticks in the Top Forex Trading Companies In India, and how they can be used to identify trend continuation patterns and reversals.
Candlestick In Forex
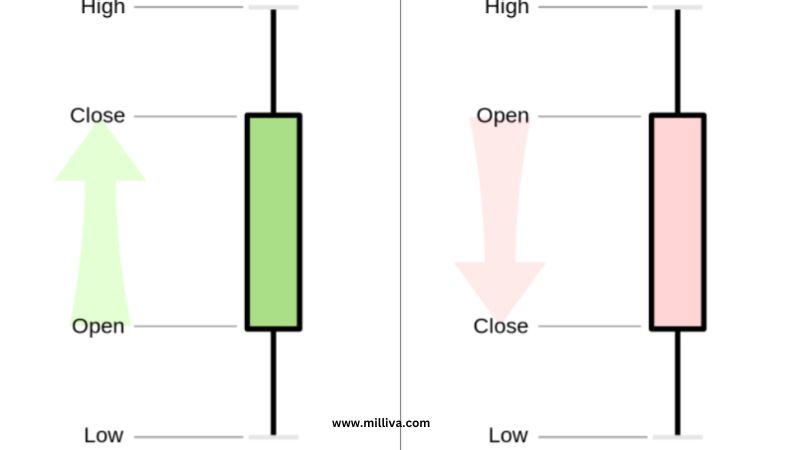
Candlestick charts are OHLC charts that represent open high low close. Like bar charts, candlestick charts show each trading session’s opening, closing, and high prices. The opening and closing prices are represented by the solid body of the candle, while the high and low prices are drawn as upper and lower wicks, respectively. The following graphic shows how a single candlestick is formed.
Candlesticks are bullish when the closing price is higher than the opening price and bearish when the closing price is lower than the opening price. This is important to understand once we get to the candlestick patterns and wicks section.
Origin Of Candlesticks In Forex
Candlestick charts originated in Japan and were used by Japanese rice traders. Before Steve Nisson brought them to the Western world, European and American traders primarily relied on bar charts, which displayed the same information about open, high, low, and close prices as candlestick charts. The main difference between bar charts and candlestick charts is that bar charts do not have a solid body and indicate opening and closing prices with small lines on the left and right sides of the bar in the Best Site For Forex Trading In India.
Types Of Candlesticks In Forex Trading
Now that you know what a candlestick is in forex trading, let’s explain the different types of candlesticks. In essence, candles can be either bullish or bearish. As we have already said, a bearish candle is formed when the closing price is below the opening price, while a bullish candle is formed when the closing price is above the opening price. The traditional color of the body of a bullish candlestick is white, while the body of a bearish candlestick is black. However, modern trading platforms like MetaTrader 4 allow you to change the colors of the candles as you wish.
Reading Candlesticks In Forex
Forex candlesticks can be read in different ways depending on the size of their solid body, top and bottom wicks, and the appearance of the surrounding candles. While we will cover some of the most important candlestick patterns in the following section, we will quickly explain the psychological meaning behind individual candlesticks.
A long solid bullish body with no very short or wicks – this candle suggests that the closing price is relatively far from the opening price, and buyers are very much in control. The absence of wicks indicates that buying speed is too high.
A long solid rough body with very short or no wicks – this candle is very similar to the description above, only in this case, the sellers are in control.
Small-Body Long Top Wicks – This candle indicates that buyers were initially in control, with prices higher during the trading session. Still, sellers eventually jumped into the market and pressured the final price to close below the high. It indicates volatility in the market.
Short Body Long Low Wicks – Long Low Vicks suggest that sellers were initially in control, but buyers could push the price up and close the trade near its opening price. Like the previous category, it indicates instability in the market.
Candlestick Patterns
Candlestick patterns are specific patterns of one or more candlesticks that can be used to anticipate trend continuations and reversals. We have already mentioned the Doji candlestick, a candlestick pattern that signals the market without any natural body.
Engulfing Patterns
An engulfing pattern consists of two candles. In a bullish engulfing way, the first candle is a short bullish candle, and the second candle is a long bullish candle, which completely engulfs the previous candle and indicates that buyers are taking control of the market.
Star Patterns
Star patterns are usually triple candlestick patterns that can be bullish or bullish. In the rough star pattern, also known as the evening star, the first candle is solid and elegant, followed by a small, fuzzy candle like a doji or spinning top.
Three Soldiers/Crow Pattern
Like the evening star pattern explained above, the three pawns pattern is also a three-candlestick pattern. It consists of three solid candles close to their high price, creating a very short candle without wicks. Three strong bullish candles suggest that buyers are in control over the past three trading sessions, and prices may continue to rise.
Closing Thoughts
Candlestick charts in Forex are OHLC charts that show the opening, high, low, and closing prices for a trading session. Candlesticks are easy to interpret and graphically impressive, making them one of the most popular chart types in forex trading in the Best Online Forex Trading Platform In India.

Visit us at: www.milliva.com