Crab Pattern in Harmonic Trading in Forex

![]()
What Does the Harmonic Crab Pattern Entail?
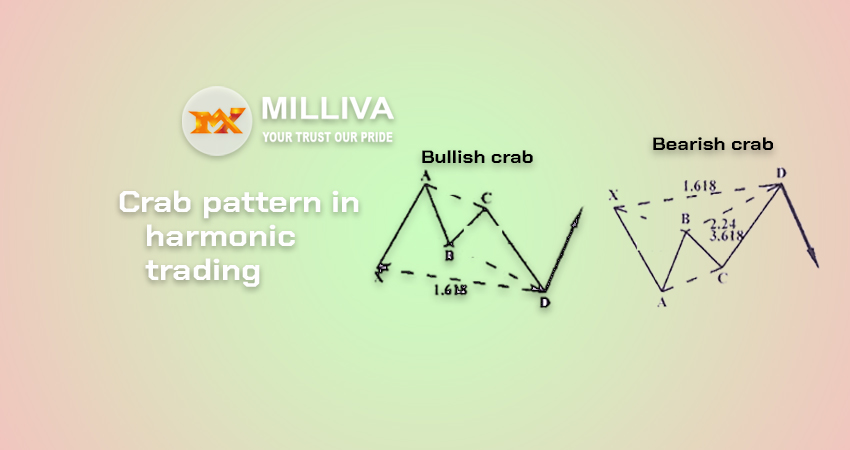
In 2001, the Harmonic Crab pattern known the Crab Pattern TM. Like other harmonic patterns, is a reversal pattern. As a result, the bearish Crab pattern indicates bearish price reversal and the bullish Crab pattern which indicates a bullish price reversal.
And, like with other harmonic patterns, each leg in the structure has its own naming scheme.
Each leg, beginning with the swing high or low, is label with a letter. There are five swing points labelled X, A, B, C, and D. Some harmonic patterns only include four notes, including the X, A, B, and C.
Because of the strong movement of the CD leg, the Crab pattern stands out. This is normally a Fibonacci retracement of the XA leg, the first portion of the Crab pattern, at 1.618 percent.
To validate a this pattern, one must adhere to a set of precisely defined guidelines. The rules that determine the validity of a Harmonic this pattern listed below.
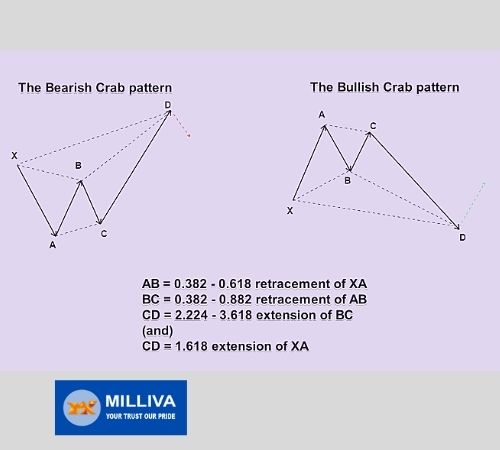
The point B in price is a retracement of 38.2 percent to 61.8 percent after the XA leg. Ideally, the retracement of XA should be less than 61.8 percent.
Pattern
The AB leg is a reversal of the preceding leg’s trend.
Following point B, the next leg, BC can reach Fib ratios of 38.2 percent – 88.6 percent of the AB leg. (C should never be greater than point A.)
Price then reverses again after the BC leg (moving counter direction to XA). The CD leg is typically reverses between 161.8% of the XA leg and an excessive 224.0% – 361.8% extension of the BC leg.
After the CD leg established and a this pattern checks the aforesaid parameters, a position taken. CD leg does not usually reverse at 161.8 percent. If price movement begins to stall and such a reversal occurs. It might be a high probability trade idea.
It is usually advisable to wait until point D is created before taking a long or short position.
Stops are normally placed at low or high of D and targets points A or B in the pattern.
The dotted lines represent the Fibonacci levels, while the arrowed lines illustrate the price direction. As you can see, the price extension of the CD leg is the most distinguishing feature of the Crab formation.

The Harmonic Crab Pattern:
The Fibonacci retracement and extension numbers in a Harmonic pattern might be tough to remember. Furthermore, using the Fibonacci tool to measure each leg while sketching the Harmonic Crab design can get tiresome.
Addition basic rules of the Harmonic pattern traders search the following tell-tale indications in market to simply monitoring price activity.
The BC leg normally develops within the XA leg.
C is a higher low than A in a bearish this pattern, or C is a lower high than A in a bullish Crab pattern. B creates a lower high than X in a bearish Crab pattern, or B forms a higher low than X in a bullish Crab pattern. D is the extreme, denoting a higher high or a lower low that extends beyond X.
Figure 2
displays how a real-time Crab pattern is produced and depicts a bearish Crab pattern that was formed on a 30-minute GBPJPY chart (and traded).
We used numerous Fibonacci tools to demonstrate the retracement and extension levels in the Harmonic Crab formation in this example.
To confirm the retracement, the XA retracement levels are evaluated (here, pivot B forms slightly near 61.8 percent, just qualifying for the Crab pattern).
At point C, we can see that the retracement is within AB’s 88.2 percent – 38.2 percent zone.
Price eventually surges higher, reaching the 161.8 percent Fibonacci extension of the XA leg and fitting inside the 222.4 percent – 361.8 percent extension of the CD leg.
Following the peak, a short position with stops at the high of CD, which signals the price reversal zone, might be taken (PRZ).

Visit us on: www.milliva.com


Bearish Crab Pattern in Harmonic Trading
06th Jul 2022[…] a forex chart, we see an example of a bearish Deep Crab pattern. The EURJPY is the currency in question. Keep in mind that this isn’t a textbook example. […]
Gartley Parttern in Harmonic Trading in Forex
28th Sep 2022[…] lows. It is based on Fibonacci numbers and ratios. In 1935, H.M. Gartley created the groundwork for harmonic chart patterns in his book Profits in the Stock […]