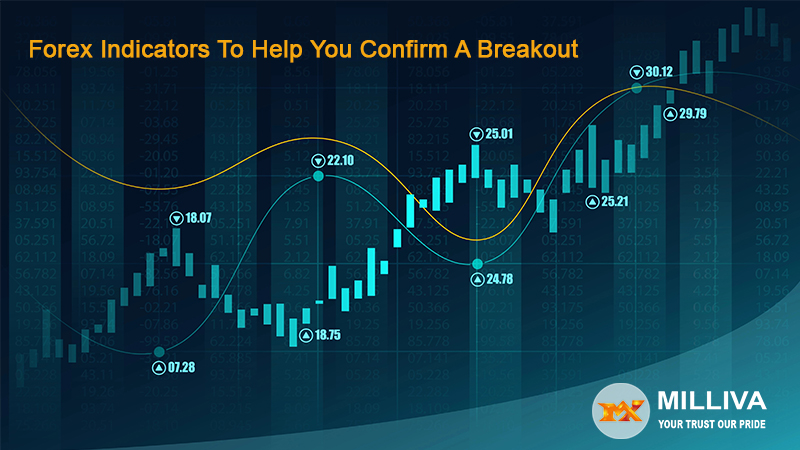
Forex Indicators To Help You Confirm A Breakout

![]()
Forex traders bring all kinds of strategies and trading timelines to the table when analyzing Forex charts in the Best Forex Platform In India. Both chart patterns and forex indicators can be used to evaluate trading opportunities depending on your personal trading preferences and the price action taking place on the forex chart.
When identifying a price breakout, technical indicators can help determine the beginning of the breakout event and the momentum it can carry for traders who open a position at the beginning of this movement. Before discussing the best technical indicators to confirm forex breakouts, let’s understand how breakouts start.
Basics Of A Breakout
Resistance and support lines provide a reliable framework for understanding price movements and potential trading opportunities. In forex trading, currency pairs typically see price movements within a fixed range, with price extensions and pullbacks often corresponding to well-known Fibonacci levels.
When the price moves beyond that resistance line, it signals a breakout, and many traders will be eager to take advantage of this price action. A breakout is a deviation from a range of price movements caused by several factors.
However, the important thing for traders is to recognize these breakouts when they occur and realize the difference between a false alarm and a real breakout that delivers profits.
To understand these price movements and identify profitable trading opportunities, most traders turn to forex indicators, which help assess the strength of a breakout. Here are three widely used forex indicators that can help confirm price breakouts in Most Trusted Forex Broker In India.
Moving Average Convergence/Divergence
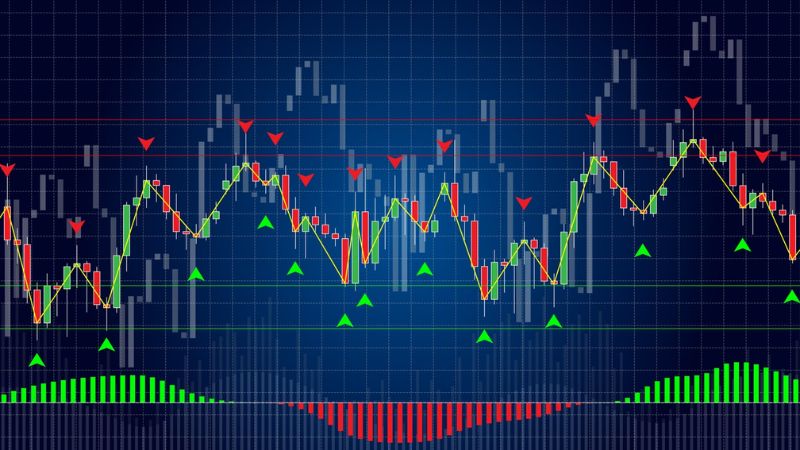
Moving Average Convergence/Divergence (MACD) is a popular tool for evaluating rapid price changes, helping traders understand the momentum of a breakout. By using a histogram, traders can see the speed of price changes as price moves approach a line of resistance and break above. With MACD, savvy traders can even spot potential breakouts before the price touches a resistance line based on the rate of acceleration for a currency pair.
Pros Of MACD
Many data points incorporated into the MACD make it a more comprehensive technical indicator than some alternatives. If you trade on shorter time frames like day trading, you can customize this indicator to calculate MACD on shorter time frames. It can improve the value of MACD in cases where the default calculations are too high.
Cons Of MACD
Note that high transients may reduce accuracy as the speed will fluctuate suddenly and wildly. The most reliable momentum estimates are achieved using this indicator in relatively stable market conditions.

Bollinger Bands
It comprises three lines: the 20-day simple moving average (SMA) and parallel lines representing two standard deviations in either direction from the SMA. Traders can use these outer bands to identify price peaks that lead to an upside breakout. When the price moves outside these outer bands, it is considered an extreme price level that can trigger a reversal breakout.
Traders can use Bollinger Bands by opening a position in the currency pair whenever the price crosses one of these bands. Consider using the Relative Strength Index (RSI) in conjunction with MACD or Bollinger Bands to gauge the potential speed of this breakout.
Pros of Bollinger
While providing value to advanced traders, this simple indicator is accessible to beginner traders. Bands offer a straightforward visual representation of currency pair prices as they move into overbought or oversold conditions. This is one of the first indicators you should use when looking for breakout opportunities.
Cons Of Bollinger Bands
The simplicity of this indicator means that errors are often made by failing to account for other important data points. For that reason, traders should consider Bollinger Bands as a starting point for identifying trades rather than as a strong indicator.
The Relative Strength Index
RSI is a simple technical indicator. However, it is relevant when you are evaluating a potential forex breakout. RSI uses a 100-point scale to analyze buying trends and determine whether conditions for a currency pair are overbought or oversold.
Likewise, if the RSI for a pair is above 70, the conditions are considered overbought, and the price is likely to decline. If the RSI is too close, you will see a market correction.
Pros Of RSI
As a momentum indicator, the RSI is a direct and natural complement to the MACD, using a better pair of indicators. RSI’s track record of identifying overbought and oversold conditions has been proven not only in Forex but in other markets as well.
Cons Of RSI
Because the data used to calculate the RSI may lag the trending market, some instances of the RSI may falsely indicate overbought or oversold levels. This is likely in shorter time frames, such as day and intraday trading, where a brief spike or decline in price can produce an unreliable RSI calculation.
End Note
If you’re new to using indicators to spot price breakouts, take your time and experiment with different combinations to see which approach makes sense for your situation. None of the indicators is foolproof, but it is a combination of analysis tools and the educated eye for forex trading and the position to capitalize on breakout opportunities in the Best Broker In India For Forex.

Visit us at: www.milliva.com


