Gartley Pattern in Harmonic Trading

![]()
What Is the Gartley Pattern, and What Does It Mean?
The Gartley pattern is a harmonic chart pattern that helps traders pinpoint reaction highs and lows. It is based on Fibonacci numbers and ratios. In 1935, H.M. Gartley created the groundwork for harmonic chart patterns in his book Profits in the Stock Market.
Gartley pattern most prominent in harmonic chart pattern. In his book Fibonacci Ratios Using Pattern Recognition, Larry Pesavento later added Fibonacci ratios to the pattern.
Comprehension of Gartley Patterns
This is most prominent in harmonic chart pattern. Fibonacci sequences used to generate geometric structures in pricing, such as breakouts and retracements, according to harmonic patterns. Fibonacci ratio found in nature has become a popular topic for technical analysts. Who utilize tools like Fibonacci retracements, extensions, fans, clusters, and time zones to study it.
The Gartley pattern frequently used in conjunction with other chart patterns or technical indicators by technical analysts. For eg, Pattern traders a broad picture perspective of where the price expected to go in the long run, while traders focus on short-term transactions in the forecast trend.
Traders can utilize the breakthrough and breakdown price objectives as support and resistance levels.
Main advantage of chart patterns is they give particular information on both time and size of price swings.
Elliott Waves, another prominent geometric chart pattern employed by traders, makes similar forecasts about future trends based on the look of price movements and their relationship to one another.

Gartley Patterns: How to Recognize Them
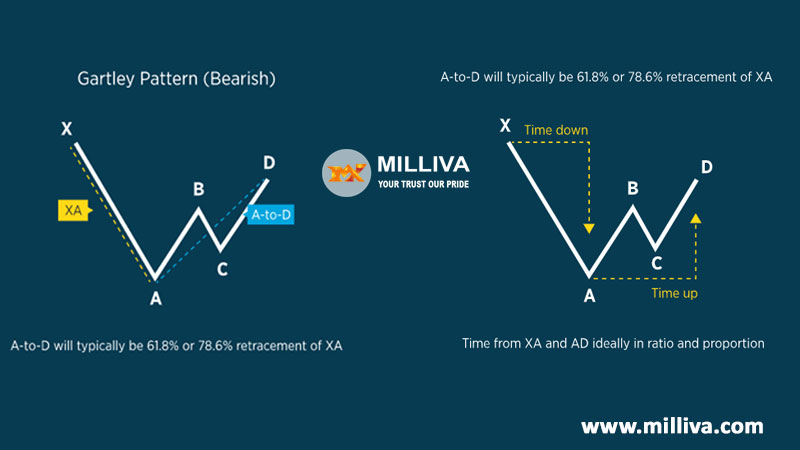
The Gartley Pattern laid out as follows
The aforementioned Gartley pattern depicts an increase from point 0 to point 1, followed by a price reversal at point 1. Using Fibonacci ratios, the retracement between point 0 and point 2 should be 61.8 percent. Point 2 is a 38.2 percent retracement from point 1, while point 3 is a 38.2 percent retracement from point 1.
The price flips to point 4 at point 3. The pattern is complete at point 4, and buy signals created with an upside goal that equals point 3, point 1, and a final price target of 161.8 percent higher than point 1. Point 0 is frequently utilized as a stop loss level for the whole transaction. Fibonacci levels don’t have to be precise, but the closer they are, the better.
When the pattern reaches completion at the fourth point, the bearish form of the Gartley pattern is just the inverse of the bullish pattern and predicts a bearish downturn with numerous price objectives.
A Gartley Pattern in the Real World
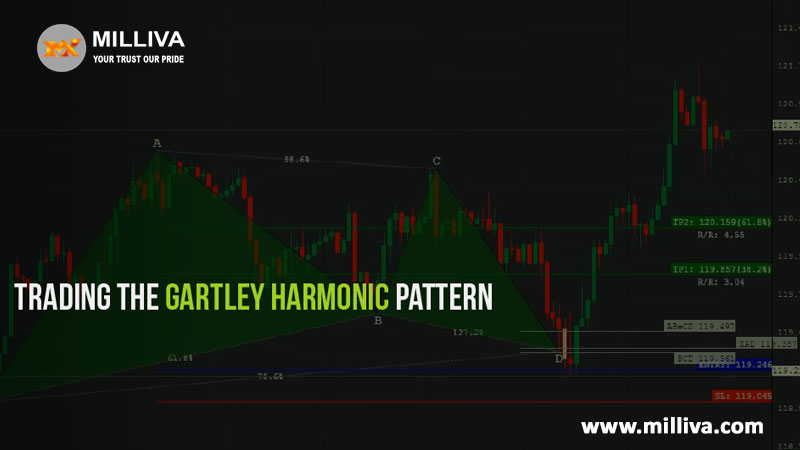
In the AUD/USD Currency Pair, here’s an Example of a Gartley Pattern
The Gartley pattern is followed by a bullish advance higher in the chart above. A stop-loss point for the transaction may be Point X, or 0.70550. Point C, or roughly 0.71300, might be used as the take-profit point.

Visit us on: www.milliva.com


XMC.pl
18th May 2022TY for posting, it had been very handy and told a great deal. Can I reference some of this on my page if I incorporate a mention of the this website?