Harami Candlestick Pattern in Forex Trading

![]()
In forex trading, the Harami candlestick pattern usually identifies trend reversals or extensions. Technical traders value the signals generated by the Harami candle. Eventually making it a valuable tool in a trader’s toolbox.
What is Harami Candlestick Pattern in Forex Trading?
The Harami candlestick is a Japanese candlestick pattern. That also consists of two candles and indicates whether the market is likely to reverse or continue. The word ‘Harami’ comes from the Japanese word. That also mean ‘pregnant,’ which is a symbol for the Harami candlestick pattern.
What is Bullish Harami Candlestick Pattern in Forex Trading?
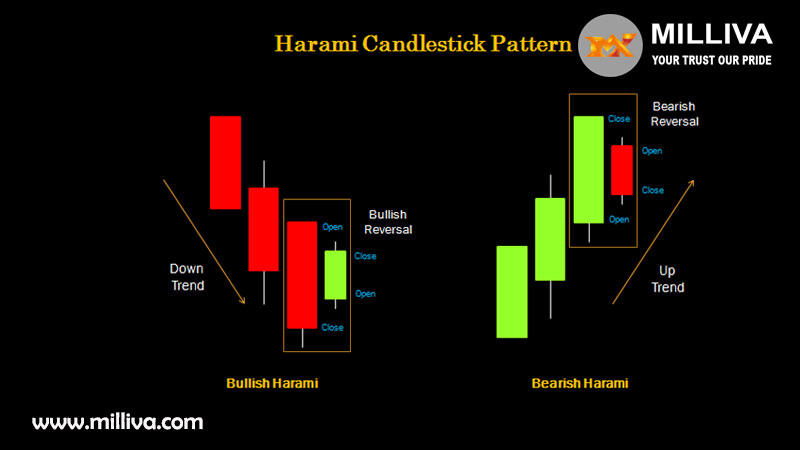
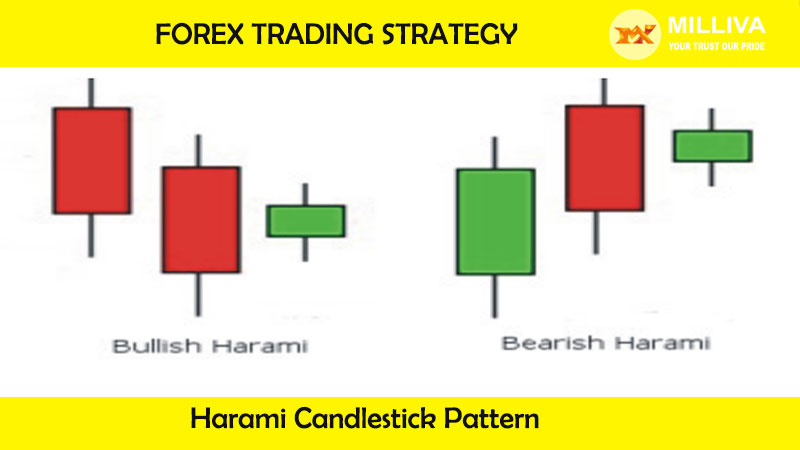
When a large bearish red candle appears on Day 1. It follows by a smaller bearish candle the next day, a Bullish Harami candlestick formed.
It’s worth noting that the bullish Harami’s most important feature is that prices should gap up on Day 2. Buyers are holding the price up. Preventing it from falling to the bearish close of Day 1.
Bullish Harami
A downward trend established firstly.
The larger bearish (red) candle in front of it is leading.
Price gaps up after a bearish candle and contains within the open and close of the leading bearish candle in the trailing smaller bullish (green) candle.
What is Bearish Harami Candlestick Pattern in Forex Trading?
When a large bullish candle appears on Day 1. And followed by a smaller bearish candle on Day 2. Then a Bearish Harami candlestick is forms.
It’s worth noting that the key feature of the bearish Harami candlestick. That prices gapped lower on Day 2. Were unable to recover to the close of Day 1. This indicates that there is apprehension about the trend’s continuation.
Bearish Harami
An upward trend established firstly.
The larger bullish (green) candle in front of it is leading.
Price gaps down after a bullish candle. And it contains within the open and close of the leading bullish candle in the trailing smaller bearish (red) candle.

Trade with Bullish Harami Candlestick Pattern
A bullish harami is a candlestick chart indicator that indicates the end of a bearish trend. A bullish harami interpret by some investors as a signal to enter a long position on an asset.
A candlestick chart is a type of chart usually track the performance of a security. It named after the rectangular shape depicted in the chart. Which resembles a candle and wicks, with lines protruding from the top and bottom.
A candlestick chart depicts the price data of a stock over the course of a single day. Including the opening, closing, high, and low prices. Investors looking for harami patterns should start by looking at daily market performance in candlestick charts.
Bearish Harami Candlestick Pattern in Forex Trading
A bullish harami relies on initial candles to indicate. That a downward price trend is continuing and that a bearish market eventually appears to be pushing the price lower. Harami patterns emerge over two or more days of trading.
And a bullish harami relies on initial candles to indicate that a downward price trend is continuing. And that a bearish market appears to be pushing the price lower.
The bullish harami indicator represents by a long candlestick follow by a smaller body. Which is also as a doj. That is completely contains within the previous body’s vertical range. The line around represents a pregnant woman. Harami is Japanese word that means “pregnant.”
A smaller body on the following doji must close higher. Within the body of the previous day’s candle to form a bullish harami for instance, indicating a higher likelihood of a reversal.
The first two black candles indicate a two-day downward trend in the asset,. While the white candle on the third day represents a slightly upward trend. Which completely contains by the previous candle’s body. Investors who see this bullish harami. Always get encouraged by it, as it can indicate a market reversal.
Trade with Bearish Harami Candlestick Pattern
When the price breaks below the pattern’s second candle, a short position takes. It accomplish by placing a stop-limit order. Which is slightly below the low of the harami candle. That is ideal for traders who don’t have time to monitor the market.
Or by placing a market order at the time of the break. A stop-loss order place above either the harami candle’s high or the long white candle’s high. By depending on the trader’s risk appetite. Profit targets can be set using areas of support and resistance.
Technical indicators, such as the relative strength index (RSI) and the stochastic oscillator. With a bearish harami, can help traders increase their chances of making a profitable trade. When the pattern forms and the indicator gives an overbought signal, a short position could be opened.
Because it is best to trade a bearish harami during a retracement in a downtrend, it may be advantageous to increase the indicator’s sensitivity so that it registers an overbought reading during a retracement.
When the indicator returns to oversold territory, profits can be taken. Traders looking for a bigger profit target can use the same indicator on a longer time frame. If the trade was entered on the daily chart, for example, the position could be closed if the indicator gave an oversold reading on the weekly timeframe.
Benefits of Harami Pattern
Simple to recognise
Chance to profit from large movements with high risk-to-reward ratios
In forex trading it is widely used.

Visit us on: www.milliva.com


Psychology of trading On Neck candlestick pattern in forex trading
30th Jun 2022[…] conclusion, A decline is expected to continue with a on neck candlestick pattern. It is represented by two candles, the first of which is towering and bearish, and the second of […]
What are Counterattack Candlestick Pattern and How Do I Use Them?
14th Jul 2022[…] candlestick charts, the counterattack candlestick pattern is a two-candle reversal pattern. It can happen in either an uptrend or a decline. The first candle […]
How To Trade The Three White Soldiers Candlestick Pattern?
13th Oct 2022[…] three black crows’ candlestick pattern is the opposite of the three white soldiers. Three consecutive long-bodied candlesticks that opened […]