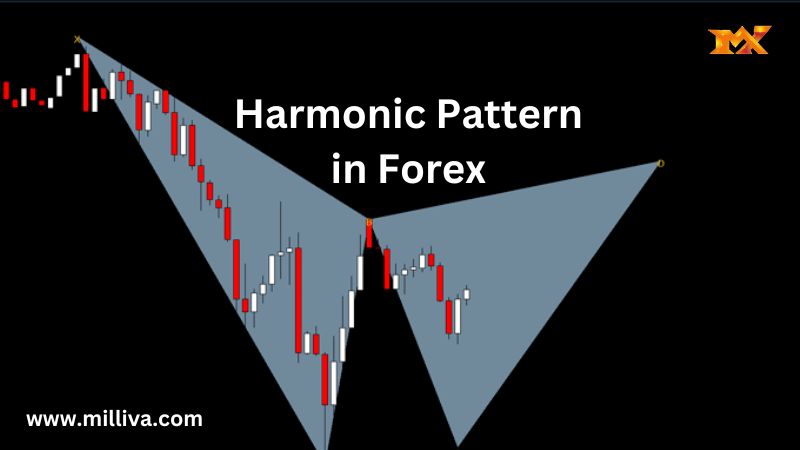
Harmonic Pattern in Forex
![]()
Traders who wish to use technical analysis must have gone through chart patterns or else employed them in trading. There may be less known, but far more accurate patterns that could project future price movement in any timeframe. Here we talk about harmonic pattern in trading. Here not only the geometric features but also the measurement of particular legs of patterns. Read further, to know how harmonic patterns are built, how they differ, and harmonic patterns in Forex.
What are Harmonic Patterns, and How Do They Work?
Harmonic patterns are based on geometric patterns, also they employ Fibonacci proportions to determine pivot points accurately. Several outstanding minds worked on their theoretical basis of harmonic patterns. The combination of both graphical and mathematical components is known as harmonic patterns. This is known to be one of the most accurate technical analysis tools, it let the traders speculate the future price movement direction and the potential trend targets.
Harmonic patterns never generate false signals. Because harmonic patterns must develop in the proper proportions in addition to some geometric features. The composite harmonic patterns will be formed when both harmonic and graphic patterns overlap each other. Thus, analyzing the market in various timeframes lets you see signals that complement each other and delve deeper into market processes. Every harmonic pattern relies on the key Fibonacci retracement levels. In any time frame, you can employ harmonic patterns.
Types of Harmonic Patterns
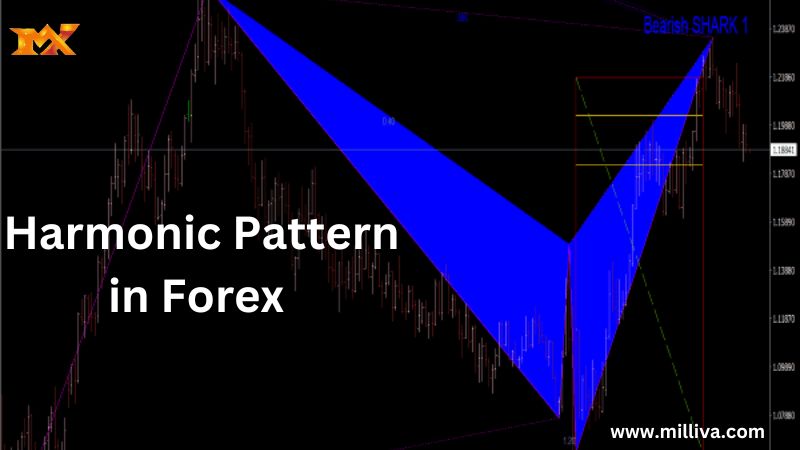
There are various harmonic patterns available out there, such as Gartley, Shark, Crab, and Butterfly. It is tough to see the difference in the beginning because they look similar. Both harmonic patterns and chart patterns can be divide into two types: bearish and bullish. Always keep in mind that in a bullish harmonic pattern, top A and C look up, and in a bearish pattern, A and C are the base of local lows and strictly look down.
The main feature of harmonic patterns is that they follow strict proportions of impulses in the XABCD wave structure. You should determine the direction of peaks A and C to find the specific harmonic pattern. Further, let’s see types of variety of harmonic models.
The Gartley pattern is a widely trade harmonic pattern and can be employ in several markets and time frames, it is also a 5-point retracement. The next one is the Bat pattern, which is a very accurate pattern, it needs a smaller stop loss than most patterns. Then Butterfly pattern, a better harmonic butterfly pattern, should possess a specific alignment of the different Fibonacci scales at each point within the structure. The crab pattern is one of the accurate harmonic patterns, it provides a pattern of price reversals that is closer to what the Fibonacci numbers indicate. The final one is the Cypher pattern, this pattern is not as familiar as other patterns and is also not widely use trading patterns among traders, it has four separate bars indicating price movements with specific Fibonacci ratios.
Advantages and Disadvantages of Harmonic Pattern
All the data and conditions for these harmonic patterns are exact and clear. The traders should deal with precise wave ratios, pivot points, and levels. This helps you to simplify the search for optimal entry points. In geometric form, the truth of harmonic patterns is establish using the waves’ relationships. Several complex formations can be compare not with one neighboring, but with many impulses with unique ratios.
In the charts, the harmonic patterns will often appear enough that traders can employ them in their trading systems regularly. You can use these harmonic patterns in all types of markets and timeframes. These harmonic patterns can be easily combine with other technical analysis tools.
At the same time, there may be various types of harmonic patterns, but their geometry is complicate. So the beginners may be confuse which let them make wrong trading decisions. This pattern is not always confirmed through the projection of price movements. Also, there are not enough accurate automatic tools for finding harmonic patterns. In real trading charts, a harmonic pattern that meets strict aspect ratio criteria is very rare. Thus, its subjective is growing in the assessment and there is a chance of a false forecast.
Why are Harmonic Patterns So Popular in Forex Trading?
Always, the Forex trader wishes to use harmonic patterns, as they are mainly suitable to the real-time dynamics of the Forex markets. When they are properly use, they can warn a trader when underlying conditions are likely to result in a price drop, based on historical data. How do you identify and draw harmonic patterns depending on the type of market movement? There are various harmonic patterns, they can be divide into two categories such as bearish and bullish patterns.
What is the Difference Between Bearish and Bullish Patterns?
Simply the traders believe that their market is about to experience an upward price movement, whereas bearish traders operate under the belief that the market is on a downward trajectory. The same rule will be apply when it comes to understanding bearish and bullish harmonic patterns.
If a harmonic pattern shows that the market is on an upswing, bullish traders might use this insight to take a long position on their chosen market, in order to benefit from any upturn. If a trader notices a bearish harmonic pattern, they can begin shorting their market, by trading stock or commodities under the assumption the price will fall.
How to Start Trading with Harmonic Patterns?
Take some time to analyze the market, and also try to learn the theory behind harmonic patterns. Then choose the pattern which you’re going to use, whether it may be a bearish strategy or a bullish strategy. Then open a trading account and start looking for harmonic patterns in your market of choice. Simply, these harmonic patterns are employ by traders to speculate future market movements.
You can take a profit by using the Fibonacci line which identifies the patterns and times your trades. You can also decide when to take a profit by using them. Always, consider two profit goals, depending on your own evaluation of a Forex asset’s potential price movements. The first goal comes at a 38.2% retracement. At this point you can safely close your position and claim a profit. In the next case, if you feel confident in the price, you can consider waiting until the 61.8% retracement. Which can capture a nice return from your harmonic pattern analysis.
Final Thoughts
These harmonic patterns may be a little more complicated to speculate than standard patterns, but they provide clear rules when you are making trades. Implement this analysis strategy into your trading plans to develop your risk management and your ability to time your trades.

Visit us on: www.milliva.com