How Can I Read Average True Range Indicator?

![]()
The average true range (ATR) is a technical analysis indicator that evaluates market volatility by breaking down the whole range of an asset price for that period. It was first presented by market expert J. Welles Wilder Jr. in his book New Concepts in Technical Trading Systems.
The largest of the current high less the current low, the absolute value of the current high less the previous close, and the absolute value of the current low less the previous close considered to be the actual range indication. The ATR is then a moving average of the real ranges, often using 14 days.
How Average True Range Indicator works?
The greater range of each bar is a sign of rising market volatility, as is an expanding ATR. The strength of a price reversal would indicated by an increase in ATR. An expanding ATR might signify either selling pressure or buying pressure because ATR is not directional. High ATR readings are typically the outcome of a rapid uptrend or downtrend and are not likely to last for an extended amount of time.
A series of periods with limited ranges indicated by a low ATR value. The prolonged sideways price action that produced these low ATR readings is what caused the lower volatility. Low ATR values for an extended length of time could be a sign of consolidation and the potential for a move or reversal to continue.
For stops or entry triggers, ATR is highly helpful in indicating changes in volatility. The ATR stop will adjust to sharp price changes or consolidation zones, which might cause an anomalous price movement in either direction, unlike fixed dollar-point or percentage stops, which do not allow for volatility. To detect these unusual price movements, multiply the ATR by 1.5.
How to Read Average True Range Indicator?
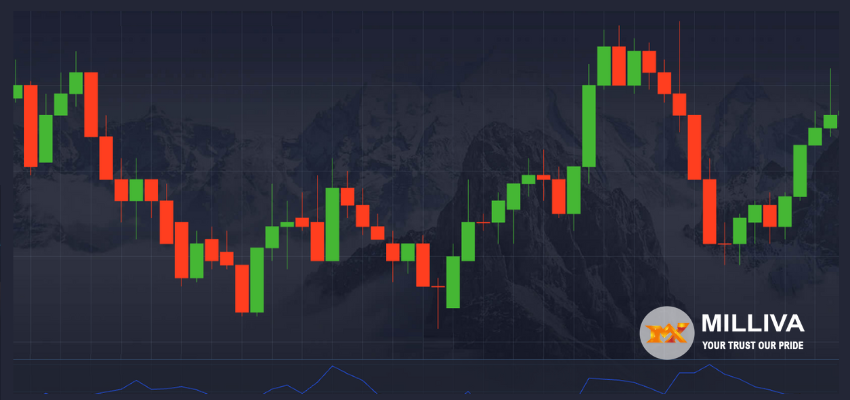
A single line in a region underneath your chart that can move up or down is the average true range indicator. It’s simple to interpret the ATR indicator: a greater ATR indicates higher volatility, whilst a smaller ATR indicates lesser volatility.
But keep in mind that ATR just displays the state of price volatility; it does not identify prospective trend directions.
Utilizing the ATR Indicator
Because it displays what happens with the price volatility of a specific asset, the ATR is a valuable indicator. Be cautious while formulating an average true range trading strategy, though, as the indicator shouldn’t employed on its own. ATR can used in conjunction with price action analysis and other indicators to alert you to changes in momentum or price direction.
Traders frequently utilise the average true range indicator to identify possible breakouts and set stop-loss orders to prevent premature closing of their positions.
Alerts for ATR Breakout
Potential breakouts can also identified using the ATR indicator. Try to keep an eye on the ATR number and search for a multi-year low. When you locate such a point, watch for the price to breach the support level because this will signal an increase in volatility and the possibility of a breakout.
The average true range formula can be used by traders to determine probable entry and exit points for their trading positions. Remember that times of high or low volatility will finish eventually, and you can take advantage of this. For instance, traders anticipate an increase in volatility following a period of low volatility, which can be the point at which you enter or exit your position.

Stop loss Trailing
Finding possible locations to place stop-loss orders or trailing stop-loss orders is one approach to apply an average true range strategy. By using this indicator, you can prevent putting either a very narrow stop loss order during periods of low volatility or a very broad stop loss order during periods of high volatility. See why ATR can be employed when establishing a stop-loss order by looking at the following graph.
Placing a Stop-Loss Order Using ATR
Putting a stop-loss order using ATR – Currency.com is to blame.
The white arrows represent periods of higher volatility, and the corresponding price fluctuations are shown during these periods. You may lock in the profit and avoid defining a tight stop loss, which would force an early exit, by taking the ATR into account when making trailing stop loss decisions.
You can establish a proper stop-loss that is sufficiently tight to ensure that you collect a specific amount of earnings during periods of lower volatility (sideways market movement). Because your stop loss will move in tandem with changes in volatility, it is advantageous to base your following stop on the ATR value.
Based on the specified distance from the ATR value, the stop loss can be implemented when changes in price action are not in your favor.
ATR
In addition to these typical uses, traders have created a variety of average true range tactics for identifying and validating potentially successful signals. They also incorporate the moving averages indicator to identify the trend direction or the RSI indicator to gauge momentum in addition to the average true range.
When you place your stop-loss order below or above the support and resistance levels, you are using an ATR trading method. Traders typically set the stop loss distance from the ATR value at one, two, or three times the ATR value.
The fact that traders develop their own average true range trading strategies in addition to their own general trading strategies means that this does not necessarily imply that it should be regarded as the rule.

Visit us on: www.milliva.com


