Hanging Man Candlestick Pattern in Trading?
![]()
The Hanging Man candlestick pattern is a reversal candlestick pattern. That comes at the top of a bullish trend and signifies a price reversal in technical analysis. This pattern uses majority of price action traders to determine the most trustworthy point to begin a sell trade.
In the market, candlestick chart trading has grown in popularity. Furthermore, its efficacy aids traders in locating lucrative transactions in any financial market. Candlestick trading originated in the stock market, but it has since expanded to include forex currency and cryptocurrency.
As a result, current brokers employ candlestick charts, which make asset investment more profitable. The Hanging Man candlestick pattern’s price movement is similar. To those of other candlestick patterns including the Hammer, Doji, and Shooting Star. However, it appears at the peak of an ascending trend and may foreshadow a downward trend.
Let’s delve into the details of the Hanging Man pattern in the bitcoin market.
What is the Pattern of a Hanging Man Candlestick?
The Hanging Man is a bearish candlestick pattern. That comes at the top of a bullish trend and indicates a negative reversal. Following a long bullish run, this pattern indicates that the trend may be about to turn. Since the bulls look to be losing steam.
Although this pattern does not indicate a trend shift. It does send a signal that the price has already reached its peak.
The Hanging Man candlestick pattern is a warning indicator for purchasers. Who wish to maintain the price for further profit on a price chart. It assists purchasers in managing their trades by allowing them to exit the market with a profit, assuring a profit. For sellers, on the other hand, it signals a prospective entry point, pending further confirmations.
Let’s have a look at the Hanging Man Candlestick Pattern
When the open, high, and close prices are almost the same, the Hanging Man formation form, just like the Hammer. A large lower shadow, at least twice the length of the true body, is also present.
Red vs Green
When high and open are the same red bearish Hanging Man candlestick is formed. Green Hanging Man is formed when the high and close are the same since this pattern is considered a stronger bearish indication. Despite the fact that the green Hanging Man remains bearish. It appears to be less so now that the day has closed with gains.
Characteristics of Hanging Man
Small genuine body little or no top shadow (wick), and a lower shadow at least twice the length of the body define the hanging man candle. The hanging man can only be recognized as such once it has developed at the peak of an upward trend.
Opening level: The hanging man candle can be green (bullish) or red (bearish), but the bearish candle indicates a falling market better.
Upper shadow: A modest upper shadow shows that an attempt was made to preserve the present uptrend prior to the substantial decline in the Pound Sterling’s price.
Long lower shadow: This is arguably one of the most perceptive observations on the candle, illustrating a large sell-off before the bulls attempted to reclaim some ground, causing the closing price to wind up slightly closer to opening levels but still down for the time.
Closing level: The closing level in this example was lower than the opening level, confirming that this is a bearish hanging man candle.
Trading Signals from Hanging Man Candlesticks
Because the extended shadow suggests enormous selling, the hanging man candlestick may be used to detect a short trade (bearish perspective of the market). The actual test of the hanging man candlestick’s authenticity is frequently discovered in later chart activity.
If the following candle falls deeper and breaks below the short-term rising trend line, the negative long-term trend is expected to continue. Another probable entry point would be after the market has moved past the low of the hanging man candle.
Trading with Hanging Man
It’s crucial to consider the hanging man candle formation in the context of the overall trend. Using several time frame analyses is the best approach to achieve this. Begin by looking at the market on a larger time frame chart, such as the daily or weekly time frame, to see where the market is heading in the long run.
Then, using a smaller time frame chart (4 hours or 2 hours), zoom in to figure out where the best entry point for your trade is.
Step 1: Determine a Long-Term Trend
To obtain a sense of the market’s direction, look at the chart on a longer time frame (say a daily chart). You should avoid trading in the opposite direction of the long-term trend.
Step 2: Identifying a Good Entrance Point
Determine the best entry point using a shorter time frame chart (4 hour chart). A signal for a short trade is provided by the hanging man candle formation.
Step 3: Incorporate Supporting Indications into Your Plan
Is the RSI indicating that the market has turned and is currently trending downward? and Is the 20 SMA line now crossing the 50 SMA line? and Is there a hanging man candlestick towards the top of the short-term uptrend? Is there a Fibonacci retracement level that is useful nearby?
Step 4: Make a Trade
At the bottom of the hanging guy candlestick, look for an access place. If your pessimistic perspective of the market is right, following price action will move lower, giving you a cue to enter a short bet.
Step 5: Managing Risk
Make sure your trades are in line with your position size plan. Consider how much of your account’s overall worth you’re willing to risk at any one time and stick to it. We speak about risking less than 5% on all open transactions. Also, make sure your stop is at the highest point of the hanging man candle pattern.
Step 6: When Should you Exit the Trade?
It is usually advisable to have a risk-to-reward ratio of at least 1:2 when starting a transaction. You’re putting half of everything you’re hoping to acquire at danger. This means that the distance between your entry and take profit levels should be twice as long as the distance between your entry and stop loss levels.
Even if you only get half of your deals right, you’ll still have a positive trading account if you use this basic approach. In our research on the Traits of Successful Traders, we discuss these trading insights.
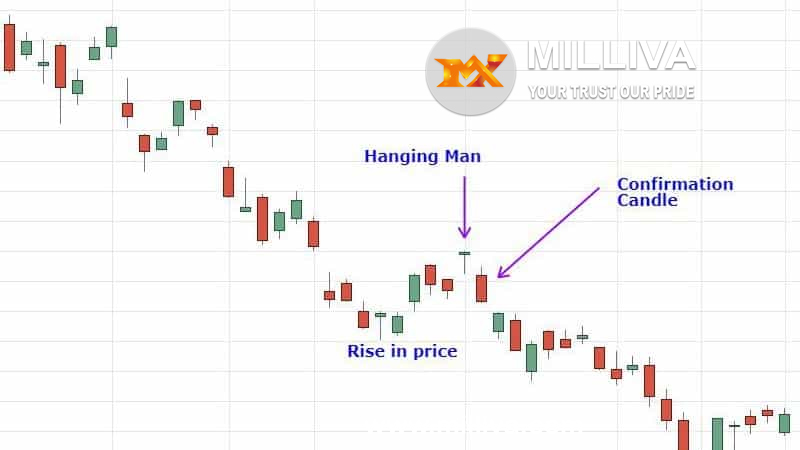
How to Use a Hanging Man Candlestick Example
A hanging man candle forms on the chart, which suggests a price decrease followed by a short-term price gain. The price declines on the next candle after the hanging guy, providing the necessary confirmation to complete the pattern. Traders might enter short trades during or after the confirmation candle.
The example shows that the hanging guy does not have to arrive after a long wait. Instead, it might signal the end of a short-term uptrend within a longer-term downturn.
Hanging Man Candlestick’s Limitations Waiting for confirmation might result in a bad entry point, which is one of the weaknesses of the hanging man and many candlestick patterns. Within two periods the price might fluctuate so fast that the possible profit from the transaction may no longer justify the risk.
Because candlestick patterns do not normally indicate profit goals the reward might difficult to measure at the start of transaction. Instead, traders must exit any trade started with the hanging man pattern using other candlestick patterns or trading systems.
Even if there confirmation candle there is no guarantee that the price will fall once a hanging man develops. When starting short trade it is recommended to place a stop loss above the high of the hanging man to control risk.
In summary, Hanging guys are a common occurrence. When you put them all on chart you’ll notice the majority of them are poor forecasters of a price drop. The pattern becomes more dependable if there is more volume, a sell-off the next day, and longer, lower shadows. If you’re going to trade it, set your stop loss above the height of the hanging guy.

Visit us : www.milliva.com