Average Directional Index (ADX)

![]()
How to Use ADX
Welles Wilder, a well-known technical analyst, created the Average Directional Movement Index (ADX) as a trend strength indicator. Wilder created the indicator for trading commodities futures as a commodity trader. Technical analysts have since broadly adapted it to nearly every other tradeable investment, including stocks, currency, and ETFs.
What is ADX?
Average directional (ADX) movement index is produced to reflect the growth or contraction of a security’s price range over time. ADX indicator standard value is 14 time periods, however analysts used it with settings as low as 7 and high as 30.
Lower values cause average directional index to respond to price change more quickly, but they also produce more false signals. Higher values reduce spurious signals, but the average directional index becomes more lagging.
Wilder arrived at the average directional index (ADX) by computing both a positive directional movement index (+DMI) and a negative directional movement index (-DMI) that compare current high and low prices to the high and low prices of the prior time period. The sum of the differences between +DMI and –DMI during a certain time period is then used to determine the average directional index (ADX).
All of the required computations are a little complicated. You don’t have to do things yourself, thankfully. All you have to do is apply the average directional index indicator to a chart, and the indicator will complete all the calculations for you based on the time frame you select. The default number of time periods is 14, once again.
Formulae for the Average Directional Index (ADX)

Because of the various lines in the indicator, the ADX necessitates a series of Calculations
Calculating the Average Directional Movement Index (ADX)
Calculate +DM, -DM, and the true range (TR) for each period. Fourteen periods are typically used.
+DM = current high – previous high.
-DM = previous low – current low.
Use +DM when current high – previous high > previous low – current low. Use -DM when previous low – current low > current high – previous high.
TR is the greater of the current high – current low, current high – previous close, or current low – previous close.
Smooth the 14-period averages of +DM, -DM, and TR—the TR formula is below. Insert the -DM and +DM values to calculate the smoothed averages of those.
First 14TR = sum of first 14 TR readings.
Next 14TR value = first 14TR – (prior 14TR/14) + current TR.
Next, divide the smoothed +DM value by the smoothed TR value to get +DI. Multiply by 100.
Divide the smoothed -DM value by the smoothed TR value to get -DI. Multiply by 100.
The directional movement index (DMI) is +DI minus -DI, divided by the sum of +DI and -DI (all absolute values). Multiply by 100.
To get the ADX, continue to calculate DX values for at least 14 periods. Then, smooth the results to get ADX.
First ADX = sum 14 periods of DX / 14.
After that, ADX = ((prior ADX * 13) + current DX) / 14.

How does Average Directional Index (ADX) Works?
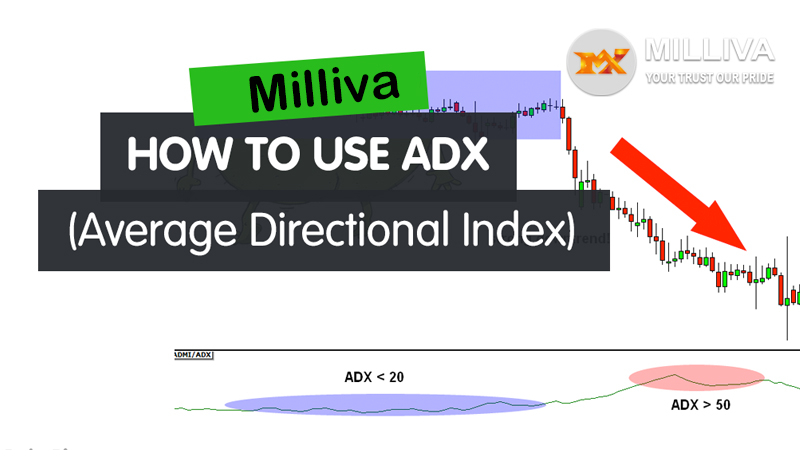
When the ADX is above 25, according to Wilder, there is a strong trend, and when it is below 20, there is no trend.
When the ADX falls from high levels, the trend may be coming to an end. You might want to do some more research to see if closing open positions is the best option for you.
If the ADX is falling, it could mean that the market is getting less directional and that the present trend is fading. As the trend shifts, you may want to avoid trading trend systems.
If the ADX climbs by 4 or 5 units after staying low for a long time (for example, from 15 to 20), it could be a hint to trade the current trend.
When the ADX rises, the market is displaying signs of strength. The slope of the trend is proportional to the ADX value. The price movement’s acceleration is proportional to the slope of the ADX line (changing trend slope). The ADX number tends to flatten out if the trend has a consistent slope.
In summary, technical analysts have discovered the average directional index to be a very useful indicator, and it has become one of the most often utilized technical analysis tools available. It is one of the most accurate trend strength indicators, and it has assisted many analysts in correctly identifying range markets, allowing them to avoid being duped into purchasing fake breakouts or markets that are fundamentally flat and going nowhere.
Visit us on: www.milliva.com


