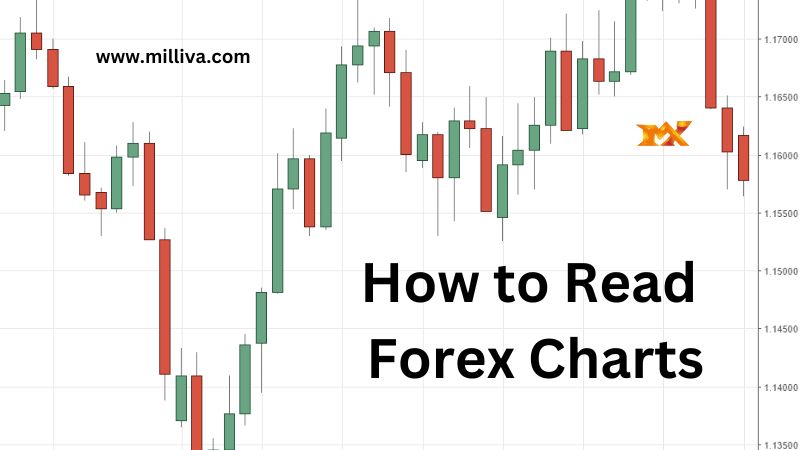
How to Read Forex Charts
![]()
Learning how to read Forex charts is one of the first steps you need to take if you are looking to get into trading. If you want to become a trader technical analysis will be critical for you, understanding trading graphs, and knowing how to read a chart can add significant value to your trading skills. To learn how to read trading charts, you need to have an eye to see the data plotting on the chart.
A Forex chart represents a graphical representation of how the price of a currency pair changes over times. The price values are plot on the Y-axis, while the horizontal X-axis shows time.
How to Read Forex Charts?
First traders want to learn to identify low and high prices, trading patterns, and trends during various time frames, to read Forex charts. However, there are three types of trading charts they are line charts, bar charts and candlestick charts.
Simply candlesticks charts represent the complete type of charts. That contain the most information’s such as open, close, high, and low price level for each candlestick.
How to Catch a Trend in Forex?
Traders use technical indicators and trend lines to confirm the overall direction or a currency price. Usually to find a trend on any trading charts. As a first step trader determine breakout move on a Forex chart where a new high or low is made and resistance or support is broken.
Then traders draw a trend lines as diagonal support or resistance level on a price chart. Finally, traders confirm or seek logical confirmation of a movement based on macroeconomic parameters.
Finding trends, whether they are going up, down or around and even understanding. When they are about to reverse, is the secret to your Forex trading. No matter what commodity you are trading, you need to know how to follow charts.
How to Analyse Trading Charts?
By analysing trading charts is crucial in this field. Eventually you will become as a good trader with time and practice. You will call as a technical trader, if you are using trading charts. Technical traders choose to adopt chart tools and metrics forecasting abilities. To define peak patterns and price ranges to enter and leave marks in markets.
Also, traders tend to monitor news outlets that provide updates on economic activity, oil production, job data, interest rate shifts, and geopolitical drivers such as conflict and political uncertainty.
We will start by knowing what the trading map is before we focus on trends and indicators. In short, the graph display the market price that exist between two financial product that are shown in a chart.
When you learn of the bullish cycle, you are looking at the general upward trend. Whereas the bearish trend is a declining trend of downs. There is a third form of the movement that is sideways, horizontal or flat.
An extensive demand happens when the commodity price approaches the same highs and lows three times. It’s said that they trade in a spread.
Different Types of Trading Charts
There are three main types of charts come forward when we talk about technical charts. They give certain information about technical charts, and they are also unique.
Line Chart
A line chart represents a simple chart type that displays trends over time. This graph usually reflects just the closing price for the span of time. In data analysis, the closing price is also consider to be the most significant factor. There is no graphic data or spectrum of trade, which means no peaks and falls and nothing about opening rates.
Simply the line chart only shows the closing price for the time period you have selected. The close prices are join together so that the consecutive points from a line. This is a very simple way to display pricing data. As it does not give any indication of what the high, low or open price for the period was.
Many Forex traders only use line charts when assessing long-term trends. Where some of the additional information may not be quite as relevant as it is when trading short-term patterns.
Bar Chart
A bar chart is a graphical representation of open, high, low, and close price values consisting of an opening foot facing left, a vertical line and a closing foot facing right. A bar chart shows a bar for each time period the trader is viewing.
The bar chart is unique as it offers much more than the chart such as the open, high, low and close values of the bar. The dash on the left represents the opening price and the dash on the right represents the closing price.
The high of the bar is the high price the market traded during the time period selected. The low of the bar is the lowe price the market traded during the time period selected. The green bars are known as buyer bar as the closing price is above the opening price. The red bars are known as seller bars as the closing price is below the opening price.
What is a Candlestick in Forex Trading?
Candlesticks represents a type of price chart that displays the high, low, open, and closing prices of a security for a specific trading period. The candlesticks body represents the price range, open to close. The wick or the shadow shows the highs and lows.
Candlestick chart is similar to the bar charts, in 17th century the Japanese started to use a scientific method for the trade in rice known as technical analysis. There is a fascinating truth that Japanese candlesticks are widely used even today.
Learn the Graphical Analysis of Charts
The concept of chart patterns is premise on the idea that human behaviour does not alter quickly. And so history continues to replicate itself. Chart patterns illustrate the psychology of capital markets, assuming that they have succeeded in the past.
A few crucial patterns to know are the triangles. A continuity pattern that indicates a war taking place amongst soaring and declining values. This means that the price is ultimately likely to proceed in the direction it headed until the trend was detect.
Another prominent trend to recognize is the double top. Showing the value reaching two highs and suggesting the price reversing to the bearish way from the bullish pattern.
Learn to Use Indicators
When you are more acclimatized with reading and analysing graphs. You can add additional instruments, like technical measures, to calculate price movement and change in value. The statistical metrics can help you learn whether stocks are oversold or over-purchase.
If a stock is oversold or over-purchase, it fails to sustain its course, which sometimes indicates a turnaround is inevitable. You can use momentum sensors, such as oscillators, to calculate the asset prices speed or velocity.
Other ways of analysis can allow you to determine when to take a trading position or leave a trade. Including the Bollinger bands. Trend line metrics such as the moving average clearly help you determine how the market moves. By cutting off all the noise from small price fluctuations.
Using Technical Analysis to Forecast FX Prices
While this has introduced the basic concepts you need to know to read Forex charts. Many experienced traders use more advanced technical analysis to forecast price movements. Technical analysis involves studying chart patterns and formations to predict the future direction of markets price.
Final Thoughts
When first looking at Forex charts, it can seem daunting. However, understanding the price and time axis helps to determine what has happened historically. Which could help to identify what is more likely to happen next.
All three different chart types have unique characteristics, with candlestick charts the most popular among traders around the world. Identifying patterns from candlestick charts such as a bearish or bullish can help traders identify possible turning points and the beginning or end of market cycles.

Visit us on: www.milliva.com