How To Trade Forex Using Trend Band Breakout Strategy

![]()
The goal of a band breakout strategy is to place a trade as soon as the price succeeds in leaving its trading range. When trading the forex market, different traders use different methods and techniques. Although some traders may fervently hold the opinion.
That their strategy is either the greatest or the only way to trade. The reality is that there are numerous ways to carry out a forex transaction. There are various ways to skin a cat, as the saying goes.
The use of technical indicators vs the avoidance of technical indicators by traders. It’s one of the key distinctions between traders. The opposing strategy, according to both parties, is the worst method to trade the market. However, a lot of traders make money with either one or the other.
Technical indicator users frequently think that these tools are the greatest available for trading. Without an indicator, it would have been impossible for them to perceive some things. They can also make methodical trade decisions thanks to it.
Band Breakout Strategy:
Trading without technical indicators, on the other hand. Its typically involves using price movement, candlestick patterns, supply, market flow, or supply and demand on naked charts. They frequently think that using indicators just delays their decision-making.
Many traders use both methods, even though the majority of traders fall on either end of the spectrum.
In order to trade the market successfully. The Trend Band Breakout Forex Trading Strategy employs a methodology that includes technical indicators, price action, and candlestick patterns.
Trend Bands Indicator
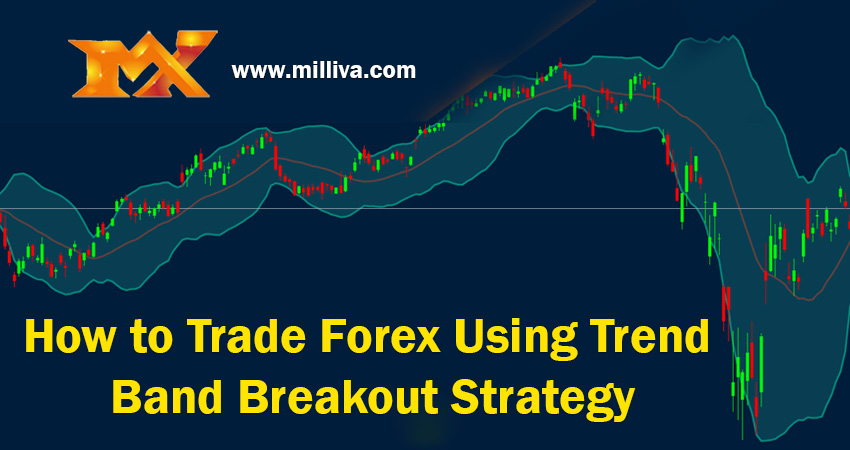
The Trend Bands indicator is a channel- or band-type indicator. That enables traders to spot momentum, oversold or overbought market circumstances, and trend direction bias.
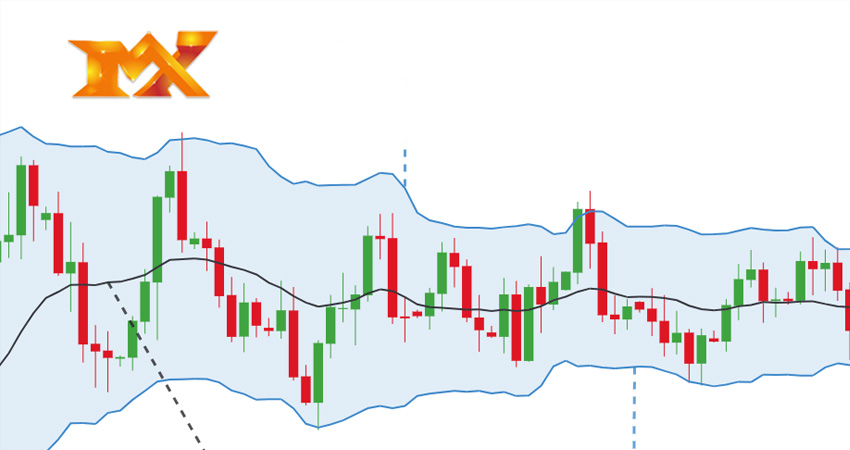
Three lines drawn using Trend Bands. A modified moving average line plotted as the center line. Based on its slope and the general placement of price movement in reference to the midline. This line mostly used to determine trend direction.
Additionally, it draws outside lines above and below the midline. These lines generated from the midline, and the derivation of these lines takes volatility into account. Overbought and oversold market circumstances typically detected using these lines.
The three lines combined form a band with two divisions. The market is in a bullish trending bias if price activity is often on the upper part of the band. Price movement that is predominantly in the lower range indicates a bearish trending bias in the market.
The market may be reversing to its mean if price is touching. The outer lines and exhibiting signals of price rejection. On the other side, if price significantly breaches the outer bands, the market may be gaining strength. Lets discuss on how to trade Forex Using Trend Band Breakout Strategy

Oscillator for Elliott Waves:
A straightforward trend-following technical indicator that appears as an oscillator is the Elliott Wave Oscillator (EWO).
It represented as histogram bars on a different window and based on the crossing of two Simple Moving Averages (SMA).
Also, It is calculated by finding the difference between a 35-period Simple Moving Average and a 5-bar SMA (SMA). It bases its calculations on the closure of each candlestick and displays the results. As bars that oscillate at a fixed point. A bullish trend bias is typically indicated by positive bars. Whilst a bearish trend bias is typically indicated by negative bars.
The Elliott Wave Oscillator has been altered in this version. In addition to the typical histogram bars. A dotted line that is derived from the original EWO bars is also plotted. The intersection of the dotted lines and the bars may serve as a tip for a potential trend reversal for traders.
Depending on whether the trend is gaining or losing momentum, the bars also change color. Green bars represent a weakening bullish trend, red bars a strong bearish trend, maroon bars a decreasing bearish trend. Lime bars represent a rising bullish trend.
Trading Technique:
This trading approach is a trend-following approach that generates trade opportunities whenever price retraces to the Trend Bands indicator’s midline.
We will be observing how price action responds in respect to the Trend Bands in order to determine the trend. With sporadic pulses breaching outside the band, price activity should mostly stay on the part of the Trend Bands indicator where the trend is moving.
The Elliott Wave Oscillator is then used to confirm the trend once more. Whether it is mostly creating positive or negative bars will determine this.
Then, we watch for retracements to the Trend Bands indicator’s midline. A support or resistance line should be easily discernible as the price retraces. Then, based on breaks from the support or resistance line, we enter trades.
Because it utilizes entry based on retracements and breakouts from resistances, which are frequent in trending market conditions, this trading method performs well in trending market situations.
Using the two technical indicators, traders may successfully weed out non-trending markets. The likelihood of a profitable trade setting increases noticeably when you trade in the appropriate market condition.

Visit us : www.milliva.com


Bollinger Band indicatorin Forex Trading
13th Jul 2022[…] envelope, touching one band before moving on to the next. These swings helps you discover potential profit objectives. If a price bounces off the lower band and subsequently crosses above the moving average, the […]
Technical Indicators: Everything You Need to Know
14th Jul 2022[…] among investors because they give accurate information regarding entry and exit positions, trend direction, and strength. They facilitate market analysis and aid in the creation of profit […]
The Worst Trading Habit “FOMO”
25th Jul 2022[…] suppress your feelings; it’s acceptable to feel upset when you lose a Transaction and Successful when you win […]
What is Average Directional Movement (ADX)?
23rd Nov 2022[…] will only tell the strength of a trend, without considering the positive or negative trend. So ADX is a non-directional indicator. You can use it for your trades, but only after […]
MACD indicator in trading - how to inbuild MACD indicator
03rd Jun 2023[…] the default periods indicated above. To make the computation easier for traders, the method below breaks out the numerous components of the […]