How to use Inside Up/Down Candlestick Pattern in Forex Trading?

![]()
What Is Three Inside Up/Down On The Inside?
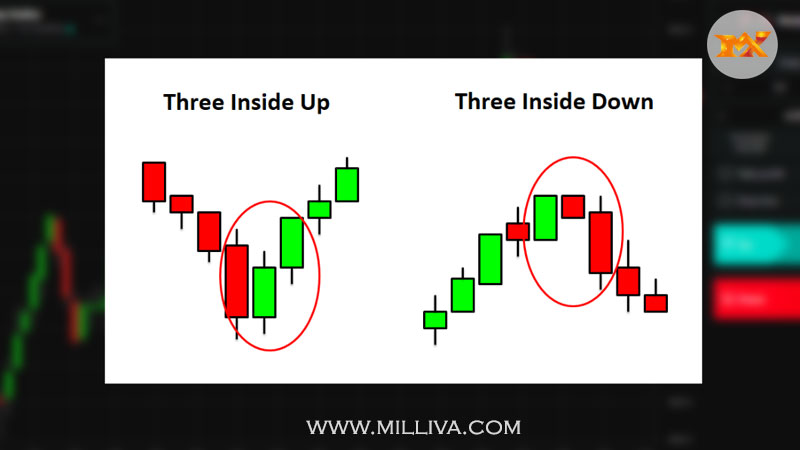
On candlestick charts, the terms “three inside up” and “three inside down” i.e three inside Up/Down candlestick pattern. Refer to a pair of candle reversal patterns (each containing three individual candles). Three candles must form in a specific order to form the pattern. It is indicating that the current trend has lost momentum and a move in the opposite direction may be underway.
Interpreting Three inside Up/Down Candlestick Patterns on the Inside
The pattern’s up version is bullish.
Indicating that the price move lower may be coming to an end and a move higher is about to begin.
The market is in a downtrend or making a downward move.
The first candle is a large real body black (down) candle.
The second candle is a small white (up) candle with a real body that opens and closes within the first candle’s real body.
A white (up) candle closes above the close of the second candle in the third candle.
The bearish version of the pattern is on the downside.
It indicates that the price rise is coming to an end, and the price is beginning to fall.
The market is moving higher in an uptrend.
The first candle is a large, white candle with a real body.
The second candle is a small black candle with a real body that opens and closes within the first candle’s real body.
The third candle is a black candle that closes beneath the second candle’s close.

How can you tell if the three inside up & down pattern is present?
Firstly, there should be a downward trend.
Then, to continue the downward movement, a tall black (or red) candle must appear.
Third, the following day, a small white (or green) candle must form, and its body must be within the previous day’s body. The price of the tops or bottoms of the bodies could be the same.
Finally, another white (or green) candle must appear, closing above the previous day’s close.
This is a confirmed bullish harami pattern, as previously stated. The harami formed by the first two candles, and the third candle confirms the bullish reversal. Because of that last candle, which provides assurance, traders are more likely to trust the reversal.
You may have found a three inside up/down candlestick pattern if you see a grouping of candles that appear to be the polar opposite of this one (a large white candle, a small black candle within it, and a black candle that closes below the previous day’s close).
Finally, consider how this pattern resembles the morning star. The main distinction is that in the three inside up method, the second candle must be within the first candle’s body. In the morning star, the final candle must also close at least halfway up the first day’s candle.
What can traders learn from the Three Inside Up/Down candlestick pattern?
Because the markets can rarely sustain rapid price movement, a reversal candlestick pattern signal is stronger if it occurs after a steep trend. A correction usually expected.
It considered a valid three inside down pattern if the second candle does not reach the halfway point of the first candlestick, but the third closes beyond the open or low of the first candle.
The bulls are attempting to take over the bears, as evidenced by the formation of this candlestick pattern. The third day formation of a bullish candle, which formed a new high, adds to the evidence that the bullish rally will continue.
When you see the Three Inside Up/Down pattern, what should you do?
This is an intriguing pattern to have in your trading toolbox.
Even though many new traders will try to apply the three insider secrets to their market as soon as they learn about it, this is not a good idea! None of the candlestick patterns are worth trading in their raw form. Filters must include to eliminate some of the false trades and make the pattern worthwhile. You must also trade in a market and timeframe where the pattern is successful. To figure out where the pattern works, it’s a good idea to do some back testing.
It not required that the pattern traded. It can simply used as a warning that the short-term price trend is shifting.
For traders who want to trade it, a long position taken on the third candle near the end of the day, or on the next open for a bullish three inside up. A stop-loss order placed below the third, second, or first candle’s low. This is dependent on the trader’s willingness to take on risk.
A trader could enter a short position close to the end of the day on the third candle or at the open the next day for a bearish three inside down. A stop-loss set above the third, second, or first candle’s high.
Because the patterns lack profit targets, it’s best to use a different method for determining when to take profits if they develop.
This could include using a trailing stop-loss, exiting at a specific risk/reward ratio, or indicating an exit with technical indicators or other candlestick patterns.
This is a very common pattern.
Because the pattern is so common, it isn’t always reliable. It is also short-term, which means that while it may occasionally result in major trend shifts, it may only result in a small to medium-sized shift in the new direction. Following the pattern, the price may not move in the expected direction at all, instead reverting to the original trend.
Trading in the same direction as the long-term trend may assist in improving the pattern’s performance. Consider looking for the three inside up during a pullback during a general uptrend. This could indicate that the downtrend is ending and the uptrend is resuming.
During a downtrend, look for the three inside downs that precede a small upward move. This could signal the end of the uptrend and the start of the downtrend.
The concept of a trading process
Keep an eye out for the first bearish candlestick to appear.
Next, keep an eye out for a smaller spinning top or doji candlestick to appear.
After that, keep an eye out for the third and fourth candlesticks to form higher highs.
Once the price breaks above the fourth candlestick, take a long position.
Place a stop-loss order below the fourth candle.
When the price breaks below the fourth candle, some traders take short positions.
Then, above the fourth candle, place a stop.
Visit us on: www.milliva.com


Bullish and Bearish ABCD Pattern in Forex Trading
01st Jul 2022[…] price decline (AB) precedes a reversal and a rise in the Bullish ABCD pattern (BC). The BC move is subsequently reversed into a fresh bearish move (CD), which takes the price […]
What does Tweezer candlestick pattern tells about forex market
02nd Jul 2022[…] prior trend is an uptrend when the Tweezer Top candlestick pattern is […]
Harami Candlestick Pattern - Bullish & Bearish Patterns in Forex Training
07th Jul 2022[…] worth noting that the key feature of the bearish Harami candlestick. That prices gapped lower on Day 2. Were unable to recover to the close of Day […]
Pullback Trend Indicator in Forex Trading
12th Jul 2022[…] the preceding example, the SPDR S&P 500 ETF (SPY) undergoes four pullbacks within the framework of a long-term upward […]
Trending and Range Bound Currencies in Forex Trading
14th Jul 2022[…] it is said to be trending in the market. Trending currency pair is defined by its consistent upward or downward movement over a period of time. It may ranging from a few weeks to more than a year. Short-term […]
How to Use Hanging Man Candlestick Pattern in Forex Trading
14th Jul 2022[…] might result in a bad entry point, which is one of the weaknesses of the hanging man and many candlestick patterns. Within the two periods, the price might fluctuate so fast that the possible profit from the […]
What are Counterattack Candlestick Pattern and How Do I Use Them?
14th Jul 2022[…] the second candle gaps higher but then closes lower, towards the closing of the first candle, for a bearish reversal during an […]