How to Trade Pennant Pattern in Forex?

![]()
Pennants are continuation patterns that show up in the currency market and that traders use to forecast future market movements. Although the Pennant pattern resembles the triangle pattern, there are some significant changes that traders need to be aware of.
This article explains Pennant chart patterns, their significance, what causes them, and most importantly, how to use them to execute trades more successfully.
What Exactly is Pennant Pattern?
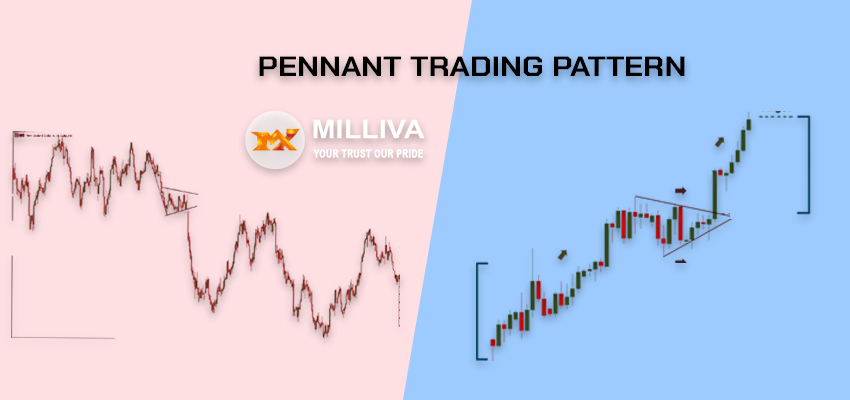
When a security suffers a significant upward or downward movement, followed by a brief period of consolidation, and then resumes moving in the same direction, the result continuation chart pattern called a pennant pattern.
The pattern, which composed of several forex candlesticks, resembles a little symmetrical triangle called a Pennant. Pennant patterns are typically categorized as being either bearish or bullish depending on the movement’s direction.
Important Features of a Pennant Pattern
The following can be seen while examining a Pennant continuation pattern:
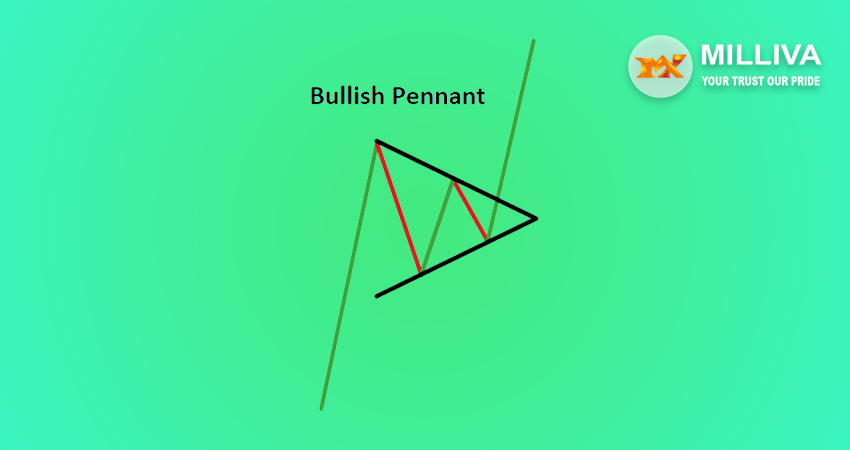
A flagpole: A Pennant pattern is unique from other sorts of patterns in that it always starts with a flagpole (such as the symmetrical triangle). The symmetrical triangle is preceded by the flagpole, which is the first powerful move.
Breakout levels: There will be two breakouts, one at the conclusion of the flagpole and one following the consolidation phase, depending on whether the trend is continuing upward or downward.
The Pennant itself: The triangle formed between the flagpole and the breakout when the market consolidates is known as the Pennant. The triangle, or Pennant, is formed by the two convergent trendlines.
Bullish Pennant Pattern
Bullish Pennants are candlestick patterns of continuation that appear during strong uptrends. The upward flagpole, the consolidation phase, and the uptrend’s continuation following a breakout all combine to produce the Pennant. In order to profit from the revived bullish trend, traders are watching for a break above the Pennant.
Bearish Pennant Pattern
A bearish pennant structure suggests that the price will face selling pressure after the breakout. A breakout and closing below the formation’s support line serve as the necessary conditions for the confirmation of a bearish pennant pattern. When this occurs, we would predict a downward price trend with a target price equal to the distance covered by the previous flagpole.
Following a significant price movement to the downside. Which sometimes viewed as an impulsive leg, the bearish pennant pattern can be seen. This impulsive leg referred to as the flagpole. The bearish pennant resembles a condensed version of a contracting or symmetrical triangle and manifests as a brief halt in the market movement, just as the bullish counterpart of this pattern.
This contracting structure will hold the price action in check, and as it approaches the apex point, we can anticipate a breakout to the downside.
A bearish pennant is valid if it breaks and closes below the support line. Frequently, a bearish marubozu candle is accompanied by this. The target price measurement operates similarly to the former method that we covered. To determine the level at which the price should fall over the ensuing leg, we will measure the length of the flagpole and extrapolate that lower from the breakout point.
In essence, many sellers who achieved a good profit from the last aggressive move down are taking some of those winnings off the table in a bearish pennant pattern. After a brief period of relative calm, another downward push is likely to occur as selling pressure increases once more.
Pennant Over
Pennant Pattern is a type of continuation pattern form in technical analysis. When there a large movement in a security known as the flagpole. Followed by consolidation period with converging trend lines called as the pennant. It followed by a breakout movement in the same direction as the initial large movement called as the second half of the flagpole.
The Most Important Aspects
You’ll notice the following while looking at a Pennant continuation Pattern:
1.A flagpole: A Pennant pattern always starts with a flagpole, which sets it apart from other designs (such as the symmetrical triangle).symmetrical triangle preceded by the flagpole which is the first powerful move.
2.Breakout levels: Two breakouts will occur, one near the end of the flagpole and the other after the consolidation phase, where the rising or negative trend will continue.
3.The Pennant: The triangle pattern generated between the flagpole and the breakout when the market consolidates. The triangle formed by two converging trendlines called as the Pennant.
Bullish Pattern

Bullish Pennants are candlestick patterns that appear in strong uptrends. An upward flagpole, a consolidation phase, and finally the continuation of the uptrend following a breakout comprise the Pennant. Traders are looking for a break above the Pennant to profit from the resumed bullish trend.
Bearish Pattern

The polar opposite of Bearish Pennants are Bullish Pennants. In powerful downtrends, bearish pennants are continuation patterns. They usually begin with a flagpole – a significant price drop followed by a stop in the downward trend. It triangular shape formed by this pause. There is a breakthrough, and the downward trend continues. On a break below the pennant, traders try to begin short bets.
Bottom line
With a little experience, the Pennant Forex Trading Strategy could be all you need to start making money from trading. These are a few of my favourite trading patterns to recognize. With this plan, we briefly discussed places of support and resistance. If you still don’t understand what we mean, take a look at the Rabbit Trail Strategy, which has a lot to say about this.
Visit us on: www.milliva.com


