Shark Harmonic Pattern to Trade in Forex Trading
![]()
What is shark Pattern?
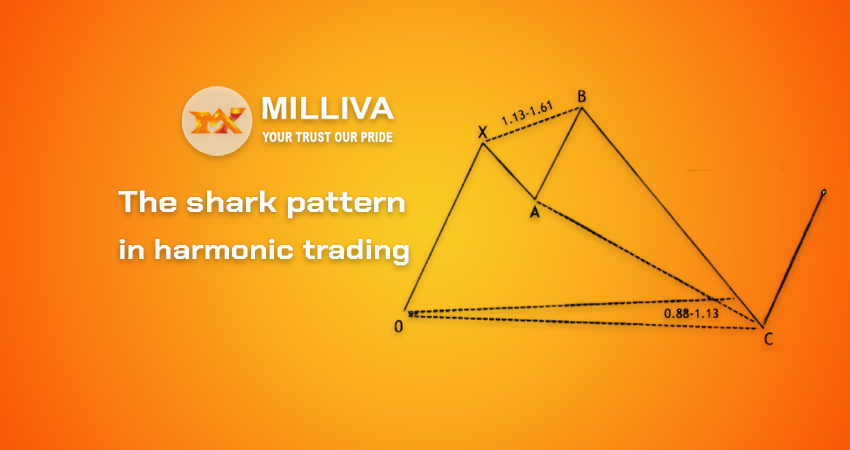
The Shark pattern belongs to the harmonic pattern family of chart formations. Scott Carney introduced it to the trading world after conducting extensive research on Fibonacci-based harmonic patterns such as the Bat, Gartley, and Crab patterns. The Shark pattern, like other harmonic patterns, has a unique set of Fibonacci connections inside its structure.
Shark pattern’s labeling convention differs slightly from the normal name practice used in most harmonic patterns. The Shark pattern’s five points are designated as 0, X, A, B, and C, respectively. This is in contrast to many other famous harmonic patterns, such as X, A, B, C, and D.
The major takeaway here is that the Shark pattern’s terminal point should be detected at the end of the BC leg, rather than the end of the CD leg, as is typical of most other harmonic structures. Traders commonly mistake the Shark pattern with the Cypher pattern.
Shark Pattern:
While each of these patterns has some similarities, there are also major differences between them that we’ll discuss later. You’ll notice a few key elements when designing the harmonic Shark pattern. When the pattern completes the B point within its structure in the context of an uptrending market period, many conventional technical analysts may recognize the pattern as a double top formation.
In the context of a downtrading market phase, the Shark pattern shows as a double bottom formation when the pattern completes the B point within its structure. In a general sense, this is how the harmonic Shark pattern is characterized. After that, we’ll take a look at the structure’s unique Fibonacci proportions. Although not essential, a Shark pattern indication will aid in the structure’s outline.
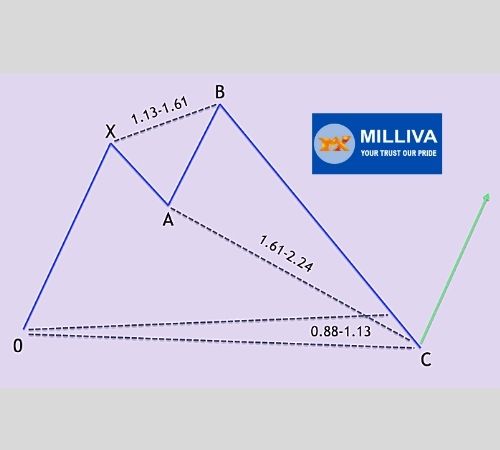
As can be seen, the Shark pattern is a five-pointed motif with four primary legs. The formation is complete when it starts at point 0 and ends at point C. The initial part of the structure is the OX price leg. Price rises from point 0 to point X, and the rise appears to be impetuous, suggesting that it has trending characteristics.
The XA price leg is the structure’s second leg. The XA leg retraces a portion of the initial positive price rise after point X achieves its apex. While the XA price leg does not have a specified retracement level, it must be less than a 100 percent retracement of the original price rise.
AB price leg –
The AB price leg is the structure’s third leg. When point A is met in the AB leg, the price continues to grow higher. This price movement finally surpasses the point X swing high. The AB leg will be a 113 percent to 161 percent extension of the preceding XA swing at the end. The BC price leg is the last price leg in the structure. The price action begins to go lower in an impulsive manner starting from point B. The price should go between 161% and 2240% of the XA leg’s length.
In addition, point C, which is between the 88.6 and 113 percent retracement of the initial 0X price movement, is the pattern’s terminal point. The structure is regarded complete at this point, and a positive price rise from this terminal C point should follow.
The Shark pattern might be seen as a sign of exhaustion. Price makes a move to the upside in a bullish Shark pattern, which is followed by a sharp price decline, which gives back most, if not all, of the gains made within the structure. A reversal is expected to occur at point C, resulting in another positive impulse leg, just as traders begin to assume that a new decline has begun.
We’ve looked at the bullish version of the Shark pattern in this example, but it’s crucial to remember that the Shark pattern may also be bearish. In this case, the pattern would be reversed.
Bullish Shark Pattern:
Let’s quickly review the key fib ratios for the Shark pattern, as well as some trade management guidelines for the bullish variant.
The OX market’s first optimistic impulsive price increase.
A piece of the first OX leg is retraced in the XA price leg.
AB price leg – This leg extends beyond point X, the swing high. Between 113 and 161 percent of the XA leg, Point B should terminate.
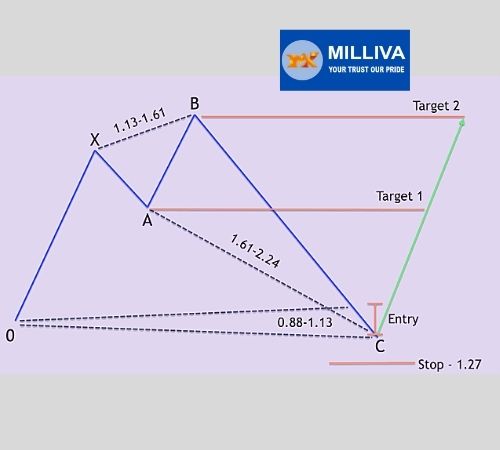
Price leg BC – As price falls, point C should end at a level that corresponds to the XA leg’s estimate of 161 percent to 224 percent. Retrace to 88 percent to 113 percent of the OX leg at Point C. Harmonic traders may now trade the bullish shark formation in a variety of ways. As a result, no overall trading strategy for this pattern exists. Some of the more common trade management tips for the bullish Shark pattern are provided below.
Place a limit order to buy between the 88 percent and 113 percent retracement levels on the OX leg.
Set a stop loss at the 127 percent extension of the OX leg.
Use a dual target scale out exit strategy, with the first target placed just below the pattern’s point A. The second target will be positioned precisely beneath point B in the pattern.
If you look at the picture of the bullish Shark pattern above again, you can see where these levels would trigger inside the pattern structure.
Bearish shark Pattern:
Let’s take a look at the current bearish Shark pattern.
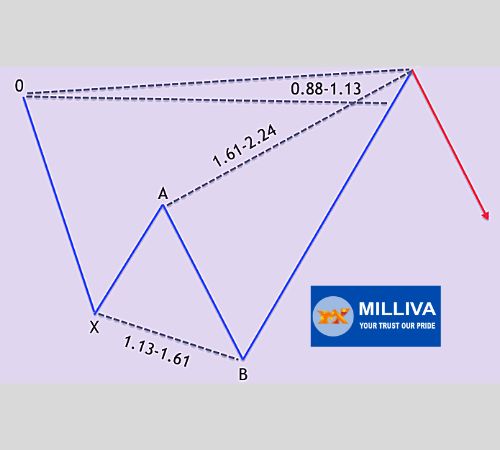
The bearish variation of the Shark pattern is seen here, along with the essential Fibonacci linkages within the structure.
The OX market’s initial negative impulsive price move.
A piece of the first OX leg is retraced in the XA price leg.
The AB price leg continues through point X, the swing low. Between 113 and 161 percent of the XA leg, Point B should terminate.
Price leg BC – As price rises, Point C should reach a level that corresponds to the XA leg’s estimate of 161 percent to 224 percent. Point C should also retrace 88 to 113 percent of the OX leg.
Let’s now look at the major Fibonacci linkages and trade management principles that apply to the bearish Shark pattern.
Traditional trade management criteria are listed below.
Place a sell limit order between the OX leg’s 88 percent and 113 percent retracement levels.
Set a stop loss at the 127 percent extension of the OX leg.
Use a dual target scale out exit strategy, with the first target positioned just above the pattern’s point A. The second target will be placed directly above the pattern’s point B.
If you look at the bearish Shark pattern graphic again, you can see where these levels would go inside the Shark pattern formation.

Visit us on: www.milliva.com




Butterfly Pattern in harmonic trading pattern
08th Jul 2022[…] Forex Butterfly pattern may be used by traders to identify the conclusion of a trending advance and the start of a […]