How to Use Triangles Trading Pattern in Forex

![]()
Triangles Trading Pattern Interpretation
The easiest way to define triangles trading pattern is to think of them as horizontal trading patterns. The triangle trading pattern is at its widest point at the commencement of its development.
The range of trading narrows as the market continues to trade sideways, and the point of the triangle is established. The triangle, in its most basic form, depicts waning interest in an issue on both the purchase and sell sides.
The supply line shrinks to match the demand. Consider the bottom triangle line, or lower trendline, as the demand line, which indicates chart support. The issue’s buyers outnumber the sellers at this moment, and the stock’s price begins to climb. The supply line is the triangle’s top line, and it indicates the overbought side of the market. Where investors are exiting with profits.

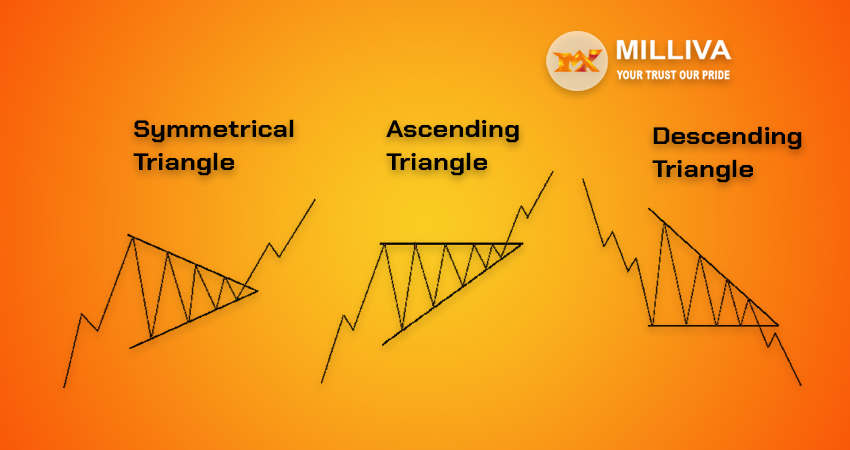
Ascending Triangle Pattern
The ascending triangle Trading pattern in an uptrend. Which is often a bullish chart pattern, is not only easy to spot. But also a slam-dunk as an entrance or exit signal. It should be emphasized for triangle to be regarded a continuation pattern, there must be discernible trend.
Demand line or lower trendline is drawn to hit the base of rising lows in the graphic, indicating that uptrend. At the top line, two highs have developed. These highs do not have to be at the same price level, but they should be near.
Buyers might not able to break through supply line right once, they might have few times before breaking new ground. The chartist will be looking for an increase in trading volume as a crucial indicator of the formation of new highs. It will take around four weeks for an ascending triangle forex pattern Trading to emerge, and it will most likely endure no more than 90 days.
Buyers Determine the Market
How do the longs (buyers) determine when it’s time to enter the market? Most analysts will enter a trade whenever the stock price breaks through the top line of the triangle with increased volume, which occurs when the stock price rises by an amount equal to the triangle’s broadest part.
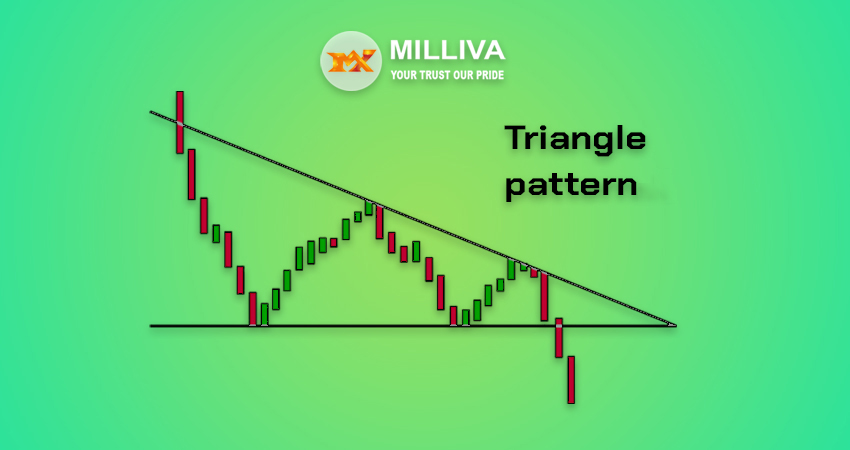
The falling triangle is usually seen in downtrends and is frequently seen as a negative indication. The falling forex triangle patterns forex is the upside-down image of the ascending triangle pattern, as shown in the figure above. The lower flat line of the triangle is formed by the two lows on the preceding chart, which must be just near in price action rather than identical.
Descending Triangle Forex Pattern
The descending triangle takes the same length of time to form as the ascending triangle, and volume plays a key part in the downside breakout once again. (According to some analysts, higher volume isn’t all that necessary.) We, on the other hand, feel it is critical. The “straw that stirs the liquid” is typically considered the strength or weakness of volume.
Symmetrical Triangle Patterns
So far, we’ve seen two triangular patterns: one from an uptrend and a bullish market move, and the other from a downtrend and a bearish market move. Symmetrical triangles, on the other hand, are considered of as continuation patterns that emerge in markets that are mostly directionless. The market appears to be moving in the wrong way. As a result, supply and demand appear to be one and the same.
The highs and lows appear to come together at the tip of the triangle during this period of uncertainty, with almost little volume. Investors are unsure of which side to choose.
In comparison to the uncertain days and/or weeks preceding up to the breakout, when investors eventually figure out which direction to take the issue, it heads north or south with a lot of volume. In most cases, the breakout happens in the direction of the current trend. Jump into the fray at the breakout point if you’re seeking for an entry point after a symmetrical triangle.

Visit us on: www.milliva.com


