Types Of Technical Analysis Every Forex Trader Should Know

![]()
Forex indicators are helpful in many ways. They serve as an operating tool in trading platforms and are connected through a different perspective on the market. They are often more concise when embedded in trading platforms. They offer long- and short-term forecasts to analyze the current state of a currency. There are different forex indicators in Best Forex Brokers In India.
What Indicators Are Best?
Many traders have favorite technical indicators, which become part of those traders’ strategies. No absolute best indicator exists because every trader’s style, personality, and psychology differ. Thus, each trader’s hands will be different. There are a few must-know indicators regarding the technical analysis.
Moving Averages
Moving averages are leading technical indicators especially developed to determine pauses in price actions, as well as the general direction of the market. They take the formation of a line marked on a chart, which measures the average or mean value of a forex pair over a set amount of time, such as 14 days or 200 days. This offers the trader a glimpse at the general trend of the currency pair. Still, it is noted that moving averages over a smaller period will react faster to price changes in the market.
Pros:
Simple moving averages are more stable than other analysis tools.
Position traders get more benefits when they use the moving averages and the traders working with the longer-term time frames.
Cons:
Moving averages are slower as they are based on historical data. So they are not able to respond fast to the market conditions.
Traders who work with shorter timeframes may need help to get meaningful insights from the simple moving averages.
Oscillators
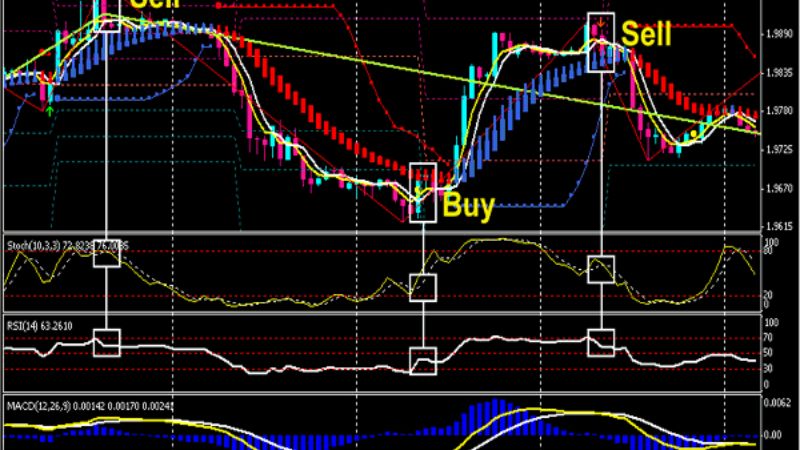
Forex oscillators indicate when the market reaches a limit, and an opposite correction of the current trend becomes the likely outcome. For example, when a price goes too high, analysts say it is overbought, which means that the price will stay stable or slide down a bit as traders work to improve their profits. New traders enter the market when a negative correction happens, raising the price. On the other hand, an oversold market causes the other direction’s reaction or an optimistic discipline. Typically, it’s better to buy oversold and sell overbought forex pairs. Oscillators are used to analyze the breaking point in the market price movement in the Best Forex Trading Platform In India.
Pros:
It is also a prominent indicator that helps traders identify trends and opportunities before price movements occur and double their profits.
It offers valuable information about the speed and momentum of the market. It gives the independence of the currency price and the high trading volume,
Cons:
False signals may occur in the leading indicators.

Stochastics
Stochastic oscillators are designed to indicate zones of overbought and oversold conditions, but stochastics also point out possible price reversals. There are multiple versions of stochastics, but slow stochastic is the most commonly implemented. Located at the bottom of a chart, it comprises two moving averages between 0 and 100.
Pros:
Stochastics are easy to understand and provide clear trading signals, making them valuable indicators for inexperienced traders.
Movements create several opportunities for traders to develop on a single forex chart.
Cons:
They can produce false signals.
The timelines for using the stochastic oscillator occasionally expand too long for day traders and scalpers, which can limit the indicator’s importance for a more concise trading duration.
Relative Strength Index
Like stochastics, the relative strength index, commonly listed as RSI, is an oscillator used to find conditions in the market that are oversold or overbought. This is particularly useful for traders who buy low and sell high because values are plotted between zero and 100. Zero is considered oversold, whereas 100 is considered overbought.
Pros:
This indicator is easy to use, and traders can set RSI alerts to notify when the currency pair reaches a specific value.
Cons
It may also give false signals, so the best way is to use the starting point for the trade evaluations.
The RSI could be more dependable when used to assess currency pairs involving volatile markets.
Bollinger Band
A volatility track is usually featured on lists describing forex indicators. Bollinger Bands are an easy idea and, thus, are widely utilized. If the price of a currency pair reaches a moving average, plus a certain amount, it indicates the start of a trend. Usually, the significances of the Bollinger Bands are two or 2.5 standard variations from a simple moving average in the Top Forex Brokers In India.
Pros:
The Bollinger Band offers a straightforward visual representation of the market. A wider distance between the two outer bands reflects increased market volatility, whereas a narrowed space reflects consolidation that could lead to a price breakout.
Cons:
It also represents the past performance of the market, which traders can find the difficulties in the trading opportunities early.

Visit us at: www.milliva.com


