Use Bollinger Band For Short Term Forex Trading
![]()
Bollinger Bands are a fantastic indicator with many benefits for Forex Trading, but sadly, many traders are unable to utilise this superb signal. Let’s quickly recap what Bollinger Band For Short Term in forex trading.
What is Bollinger Band Exactly
John Bollinger created a particular kind of price envelope he called Bollinger BandsOpens in a new window. Upper and lower price range levels indicated by price envelopes. Bollinger Bands are envelops that drawn above and below a price’s simple moving average at a certain standard deviation level. The bands’ width adjusts to changes in the underlying price’s volatility because it is based on standard deviation.
Standard Deviations, or StdDev, and Period two parameters used by Bollinger Bands. Although you can alter the pairings, the default settings for period and standard deviation are 20 and 2, respectively.
Bollinger bands assist in identifying relative price highs and lows. Both the upper and lower bands used in pairs, along with a moving average. Additionally, the pair of bands not meant to be worn by itself. Utilize the pair to verify any signals provided by other indicators.
Bollinger Bands are Made up of Three Parts
An easy moving average
This moving average’s TWO standard deviations
The Moving Average shown as a solid blue line. While the Upper and Lower Bollinger Bands shown as blue dots. (The lines in MarketClub are red.)
So What Traits do Bollinger Bands Possess?
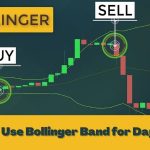
Bollinger Bands typically contain 99% of the closing prices, depending on the settings. Additionally, in sideways markets, prices have a propensity to straddle both the Upper and Lower Bollinger Bands. Given this, many traders employ the straightforward trend fading technique of SELLING when prices move outside the Upper Bollinger Band and BUYING when prices move outside the Lower Bollinger Band when using Bollinger Bands. In a sideways market, this actually functions quite well, but in a trending market, you get burned.
So How do You Prevent Burning Yourself?
By being aware of the market’s direction.
Traders utilise indicators to assess the market’s direction and determine whether it is trending. One of the three indicators I employ for this purpose is the Bollinger Bands.
Some traders like to use a moving average of 12 bars and a standard deviation of 2 for my settings while trading on the short term. The default parameters for the Bollinger Bands in many charting software programmes are 18–21 for the moving average and 2 for the standard deviation.
These options are excellent if you trade on daily or weekly charts, however John Bollinger himself advises that you shorten the moving average’s length of bars for day trading. John Bollinger recommends a setting of 9 to 12, but I think 12 is the finest.
With these settings, you will observe that when prices are in an uptrend, the Upper Bollinger Band beautifully points upward and frequently touched. Similar rules apply to downtrends: If a market is down trending, you will see that the LOWER Bollinger Band nicely pointed down and that prices are touching it.
How can You tell When a Trend has Ended and the Markets are Once Again Fluctuating Sideways?
The first red flag that a trend may be ending is when prices start to stray from the Bollinger Band. And when the Upper Bollinger Band flattens, you know an upswing is over, at least temporarily.
Likewise, when prices are moving away from the Lower Bollinger Band and are no longer touching it, a downtrend is beginning to terminate. This is the first indicator that a downtrend is over. And when the Lower Bollinger Band flattens, you’ll know the move has ended.
What Applications does this Knowledge have for Trading?
So, if you employ a trend-following approach, you would begin searching for LONG entries as soon as you noticed that the Upper Bollinger Band was pointing nicely upward and that the price was touching it. You move your stop to break-even and/or begin scaling out of your position once you notice that prices are no longer in contact with the Upper Bollinger Band. And you sell your long position when the Upper Bollinger Band flattens since you know the trend has ended.
You see, when the market is in a sideways movement, there is no profit to make by staying in the market and hoping that the trend will continue. Because you may always re-enter when you notice that the market is trending again, it is best to quit the position before the market reverses course.
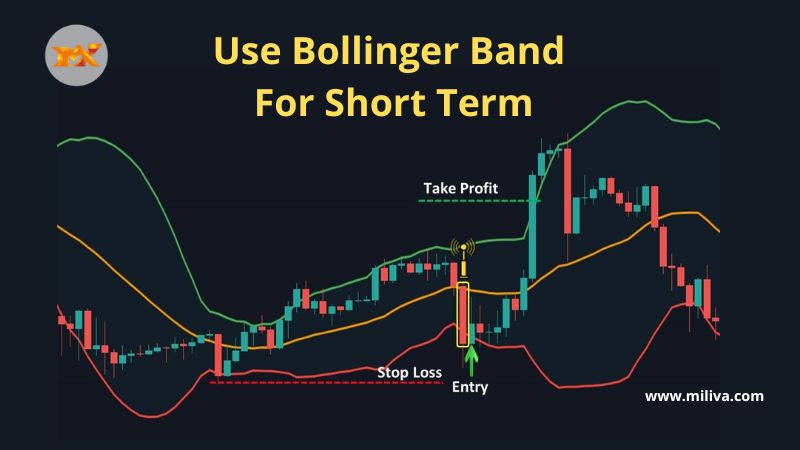
In fact, a method I call the Rockwell Simple Strategy uses price tagging an Upper Bollinger Band as an entry signal. Using this strategy, I wait until the Upper Bollinger Band begins to point up after using MACD to confirm an uptrend. I wait for the market to come to me before entering at the Upper Bollinger Band with a stop order.
Bollinger Band For Short Term
The AVERAGE DAILY RANGE is then used as my stop loss and profit target. Since we are concentrating on Bollinger Bands, this method is actually outside the purview of this post, but this is exactly how I use Bollinger Bands to gauge the market’s direction and choose the trading strategy I will employ.
As a result, I am searching for entrances using my trend-following systems, such as the Simple Strategy, as long as the Upper Bollinger Band is beautifully heading up or down. I start looking for entrances as the Bollinger Bands flatten in accordance with my sideways trading tactics. In a trending market, you should always trade a trend-following approach, and in a sideways market, a trend-fading strategy.
As you can see, Bollinger Band For Short Term are a very useful tool for determining the market’s direction and choosing a trading strategy. Bollinger Bands are frequently employed by traders to fade the market, but they can be much more effective when used to trade trends and forecast market direction.
visit us on: www.milliva.com