


How to Identify Trends in Forex Trading
![]()
A Trends in Forex Trading is a price movement that moves in one direction. The ability to accurately detect a trend can help you improve your trading results dramatically. It’s divided into three categories:
Trending upwards (bullish).
Downward Trend is Present (Bearish).
Horizontal Movement (flat). – Keys to how to identify trends in forex
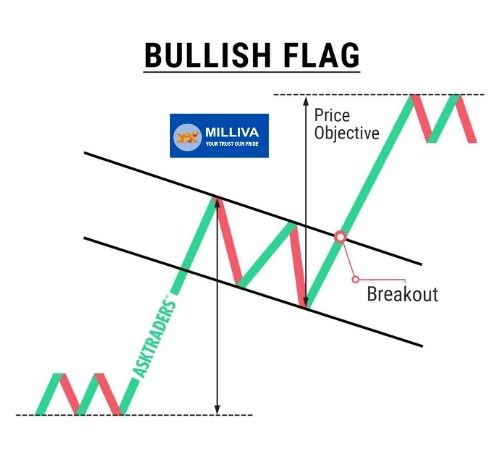
Bullish Trend
An uptrend defined as series of increasing highs and lows, with each following high and low being higher than the one before it.
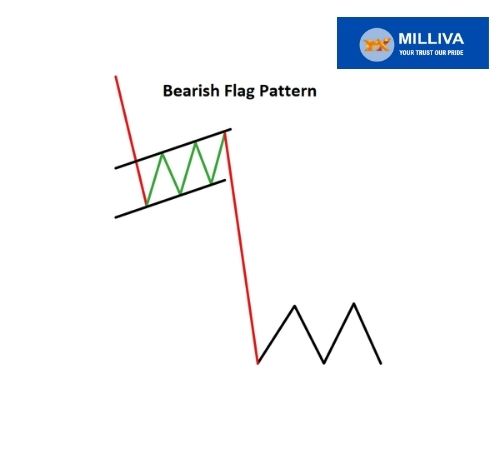
Bearish Trend
Down trend defined as series of decreasing highs and lows, with each following high and low being lower than the one before it.
Flat Trend
Horizontal trend described as a price movement that does not have an obvious upward or downward direction. Highs practically on the same level or arranged in a haphazard manner. Lows are either located along a conditional horizontal line or do not have a clear reasoning behind them.
It’s worth noting that real-world patterns rarely match the description perfectly. In an uptrend, for example, the following high may be lower than the previous one, while in a downtrend, a too high low may stand out against the general market picture.
Because reality constantly differs from theory, these deviations to the norms are inescapable. In real-world trading, it’s appropriate to think of a trend as a price movement that most closely matches the definition.
Predicting a Trend
You may receive an estimated forecast for price movement after accurately identifying a trend. Of course, the price might continually vary from the primary direction in practise.
The trend, on the other hand, helps you to figure out one very important thing: which direction is more advantageous to trade in.
Because predicting a trend reversal is difficult, trading against it frequently ends in losses and is dangerous. As a result, trading in the direction of the trend is far more sensible.
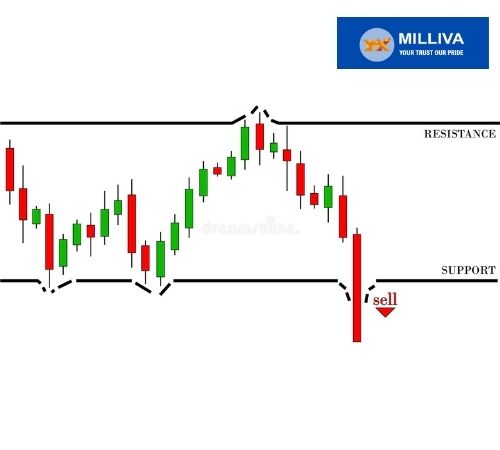
Efficient Use of Trend in Trading
It is preferable to position In the case of an upswing, place Buy orders; in the case of a downturn, place Sell orders. It’s best to avoid trading if the trend isn’t well defined, as it’s difficult to forecast price movement in this instance. You can sell in the higher zone and purchase in the lower zone if the price creates a clear sideways corridor with appropriate height.
Recognise a Trend on a Chart Without Indicators
The most apparent technique to spot a forex trend is to visually examine price movement on a chart. It’s crucial to notice where the highs and lows are. You can tell if the movement is rising, falling, or horizontal based on where they are on the chart.
Also Read: https://blog.milliva.com/single-candlestick-pattern-a-guide/
Symptoms of a Trend Include
In a downtrend, each low is lower than the previous one, while in an uptrend, each high is higher than the previous one.
The upward or downward trend is constant in the case of a trend. If we look at the hourly chart, for example, a significant price increase in a matter of hours is not a pattern. Steady price increase, on the other hand, referred to as a trend.
Market retracements are generally tiny in comparison to the big movement and the price swiftly recovers.
We can identify other aspects of forex trend not required but are frequently noticed.
A significant price impulse usually starts a trend and ends it in the same way.
Profit Taking Opportunity
The price typically slips into a flat condition before the opposing trend begins and it stays there for a long period. The current price behaviour might indicate a profit-taking opportunity.
It’s important to remember that patterns might change over time. A trend may for example, rise on the daily chart while declining on the hourly chart. In this situation, the higher period takes precedence. However short-term bearish trades permitted if the hourly timeframe used.
Remember that when the price reaches a major level on the daily period, it might change its movement direction.
As a result, knowing how to spot a market trend reversal may be beneficial to a trader.
The terms “trend” and “tendency” used interchangeably by certain traders. There is no discernible difference from a technical standpoint.
However, often assumed that propensity is a broader idea. While the trend is typically quite obvious and has well-defined traits, not always precisely defined.
Use Indicators to Spot a Trend
Trend isn’t always clearly defined it is difficult to spot it on an indicator-free chart.
Traders can benefit from trend indicators in these situations. Let’s have a look at some of the default options on the MT4 trading terminal.
It’s vital to remember that trend indicators are only useful when the market is moving in one direction, and they don’t always function when the market is moving in the other direction.
To add a trend indicator to the chart, go to the MT4 menu and pick “Insert – Indicators – Trend” from the drop-down menu.
Average of Moving Averages
The given indication is one of the most basic and often used as a foundation for further indicators. The moving average depicts the average price over a certain time period.
Different statistical weights applied to closing prices of the most recent and distant candlesticks. There are numerous forms of moving averages based on this: basic, weighted, smoothed, and exponential.
Moving averages are frequently used as support or resistance which will be as curves that move over time.
We can additionally identify other aspects of trend that aren’t required
Presence of a Trend
A significant price impulse usually starts a forex trend and ends it in the same way. The price typically slips into a flat condition before the opposing trend begins, and it stays there for a long period. The current price behaviour might indicate a profit-taking opportunity.
It’s important to remember that patterns might change over time. A trend may, for example, rise on the daily chart while declining on the hourly chart. The higher period takes precedence, however short-term bearish trades are permitted if the hourly timeframe is used.
Remember that when the price reaches a major level on the daily period, it might change its movement direction.
When +DI climbs over -DI in an uptrend, a Buy signal is issued.
When -DI comes over +DI in a downtrend, it generates a Sell signal.
Only if the ADX is increasing, indicating the presence of a trend, are both signals genuine.
It’s also time to consider profit-taking if the ADX is declining.
Bollinger Brands
The Bollinger Bands are band which is used for describing the given indication is a series of three moving average-based curves that are presented on a currency pair’s chart.
Bollinger channel borders are not set in stone and are affected by the volatility of a financial asset.
The price deviates significantly from the midline if there is no apparent forex trend. The discrepancies get bigger as the trend gathers momentum, and the channel’s borders diverge.
Bollinger Bands have a beneficial feature: the price stays within the channel 90-95 percent of the time. These findings serve as the foundation for the creation of numerous trading methods.
Bollinger Bands, on Average, Indicate
If the price has tested the middle line from above and is moving towards a trend, you should buy; if the price has tested the middle line from below and is heading towards a trend, you should sell.
Envelopes
This Indicator Having two moving averages one moved upwards and the other downwards. The wider the space between the lines, the greater the market volatility.
As a result, both lines form a channel inside which the price is most likely to remain. That is, if the price has strayed outside the bounds, it will most likely return in the near future.
As a result, the tactics for trading with “Envelopes” are based on the following logic:
During an uptrend, if the price crosses the lower line, it is a signal to purchase.
During a downtrend, if the price crosses the upper line, it’s time to sell.
Ichimoku Kinko Kyo
Ichimoku Kinko Kyo (Ichimoku Kinko Kyo)
Japanese term (Ichimoku Indicator) Many new traders are hesitant to utilise this signal because it appears to be overly sophisticated. IChimoku indicator, on the other hand, can precisely indicate not only whether or not a trend is there, but also where support and resistance are located, as well as the ideal market entry points.
The Ichimoku is a self-contained trading method, unlike other technical analysis indicators that require confirm signals and its application in trading is a vast and intriguing topic that merits its own treatment. Only the broad principle will be discussed in this essay.
The Ichimoku Indicator is Most Effective on Daily and Weekly Charts, Which is Made of 5 Lines.
The Tenkan-Sen is a nine-period moving average line that shows a short-term trend. The more pronounced the tendency, the steeper the slope.
A 26-period moving average is known as the Kijun-Sen. If the price rises above this line, the market is in an uptrend, and it’s time to purchase. Price movement below the Kijun-Sen line, on the other hand, suggests a downtrend, making Sell trades more feasible.
The indicator’s initial leading line is Senkou A. It’s the line that connects the Tenkan-Sen with the Kijun-Sen when their average period in the future is shown.
The second leading line, Senkou B, is also the midpoint between the Tenkan-Sen and the Kijun-Sen. However, it is mapped in the future by the Kijun-Sen era.
The region between the Senkou A and the Senkou B is hatched by the Ichimoku indicator. It’s known as the cloud. A sideways movement is indicated if the price remains within the cloud. The price breaking out of the Senkou A will mark the start of an uptrend, while the price breaking out of the Senkou B will signal the start of a downtrend.
Identify a Trend Using Market Sentiment Indicators
When it comes to price changes, market sentiment is the dominating emotional state of market players.
For example, you can occasionally declare with a high degree of certainty that the majority of market players are in the mood to sell. We can notice an upward tendency in such circumstances.
Traders are more ready to purchase a currency pair in other instances, and we may talk about a downturn.
You can forecast the proportion of traders wanting to make Sell orders and those eager to submit Buy orders if you correctly evaluate market mood. As a result, it will assist you in determining which situations are most likely to deliver profits.
Market sentiment analysis may appear more vague than technical analysis, yet it may help you understand the market better.
We advocate using a variety of indicators for a more objective study.
Sentiment.Lite is a free indicator that presents the bull-to-bear ratio as a histogram.
The Ratios Indicator plots the buyer-seller balance as curves beneath the price chart.
The Profit Ratio indicator is based on the logical assumption that in an upswing, only buyers may successfully trade, and in a downturn, only sellers can profitably trade.
By calculating the percentage of winning and losing transactions, the indicator can potentially reveal probable price reversal points.
Why is it Necessary for a Trader to Follow a forex Trend?
A trader profits from changes in exchange rates, and a forex trend is a movement. As a result, following a trend may be quite profitable for a trader. As a result, an indicator or instrument that can accurately predict trends is regarded as the market’s Holy Grail.
There are additional tactics that profit from price noise and counter-trend strategies, but forex trend movements yield the largest profits.
Furthermore, trading with a trend is less dangerous since it allows you to open transactions with a risk-to-profit ratio that is acceptable.
About Milliva- Best Broker For Forex In India
Milliva the Forex Trading Best Brokers In India is a significant provider of online currency (FX) trading, contract for difference (CFD) trading, and associated services. We offer account types and services that are customized to meet the needs of all levels of retail traders.
visit us on: www.milliva.com


iphone
07th Apr 2022Nice respond in return of this matter with genuine arguments and
explaining the whole thing on the topic of that.
ngoc trinh
08th Apr 2022Hello! Someone in my Facebook group shared this site with us so I came to look it over.
I’m definitely loving the information. I’m book-marking and will be tweeting
this to my followers! Exceptional blog and brilliant style and design.
Psychology of trading On Neck candlestick pattern in forex trading
30th Jun 2022[…] security is in a primary downtrend or a significant correction inside a primary uptrend. A long black genuine body displayed by the first candle. Bearish complacency grows as a result of […]
How to Use Hanging Man Candlestick Pattern in Forex Trading
01st Jul 2022[…] shadow: A modest upper shadow shows that an attempt was made to preserve the present uptrend prior to the substantial decline in the Pound Sterling’s […]
How to Trade Forex Using Trend Band Breakout Strategy
08th Jul 2022[…] three lines combined form a band with two divisions. The market is in a bullish trending bias if price activity is often on the upper part of the band. Price movement that is predominantly […]
Types of the candlestick in Forex ? Here is an overview
11th Jul 2022[…] White Soldiers is a multiple candlestick pattern that indicates a bullish turnaround. Three lengthy bullish bodies with no long shadows and open within the true body. Which is of the previous candle in the pattern […]
Should You Trade the Trend or the Range in Forex?
14th Jul 2022[…] Trend traders can make huge gains when they predict a move correctly. This dynamic is particularly true for foreign exchange (FX), where large leverage considerably increases gains. The typical leverage in foreign exchange (FX) is 100:1, which means that a trader needs to deposit just $1 as margin to hold $100 in the currency. That’s in contrast to the stock market, where leverage is often set at 2:1, or even the futures market, where even the most lenient leverage is limited to a maximum of 20:1. […]
How can You Predict Forex Market Direction
30th Aug 2022[…] Bands, Stochastic Oscillator, MACD histogram, and RSI are the most effective, according to professional advice.Let’s have a look at how the Stochastic Oscillator works as an example. It consists of two […]
know about forex price action complete guide for trader
19th Sep 2022[…] it simply, is a forex trading strategy. It allows a trader to read the market and make subjective forex trading. These decisions based on recent and actual price movements rather than depending primarily on […]