What does Heiken Ashi Candlestick Indicators Does

![]()
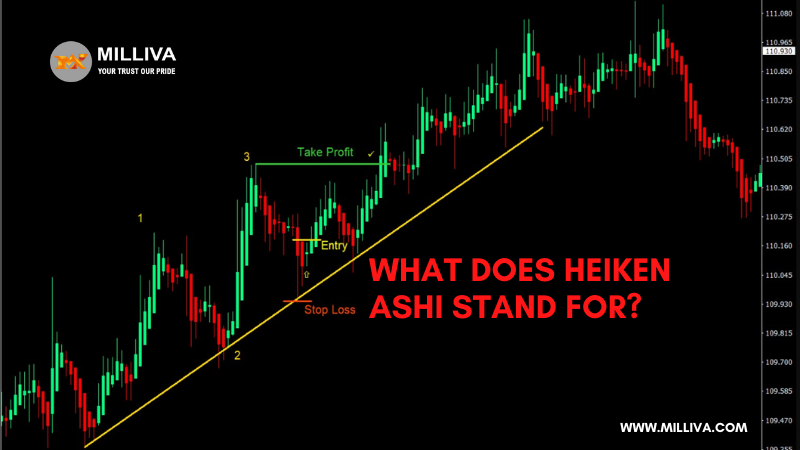
In Japanese, Heikin Ashi means “average bar.” The equation takes into account the price changes seen on a standard candlestick chart. Heiken Ashi Candlestick Indicators chart have a tendency to highlight trends and trend reversals more clearly than traditional candlestick charts since they average price fluctuations.
Whether day trading or swing trading, Heikin Ashi is helpful for short-term trading methods. Any market, including forex, equities, commodities, and indices, can use it. This style of chart and indication can aid a trader in identifying trends and maintaining profitable positions. The averaging of prices can lead to hazards; therefore, traders must grasp how it functions before utilising it.
Designs of Heiken Ashi Candlestick Indicators
Heikin Ashi is a candlestick chart variant that uses a different calculation method. Traditional candlestick charts display the high and low as the upper and lower shadows of the candle, and the opening and closing prices as the thick part of the candle (actual body). These are the exact asset’s open, high, low, and close values during that period. The data not being altered in any way.
Additionally, the Heikin Ashi contains upper and below shadows as well as a thick area known as the “true body.” The underlying asset’s OHLC values not used to construct the open, high, low, and close (OHCL) for the Heikin Ashi candle.
Instead, the Heikin Ashi candles are based on the average prices throughout the most recent and earlier time periods. Heikin Ashi charts are smoother as a result of this.
Heiken Ashi vs Renko
Candles on a Heikin Ashi chart made using an average of prices. Renko charts use a different formula and have a distinct appearance, but they help level out price movements.
Bricks or boxes of a specific size make up a Renko chart. The size may predetermined (e.g., $1 or 30 pip increments), or it may calculated using the average true range. When the price of the underlying asset changes by the required amount, a new Renko box forms.
For instance, if the trader is using a five-minute Renko chart and the box size set to $1, a new box will form whenever the price increases by $1 or more on a closing based on the five-minute chart. Bricks in a Renko never placed next to one another straight; they move and fall at 45-degree angles. Therefore, for the Renko chart to begin moving downward, a $2 decline required (or two selected brick sizes).
Even though time plotted on the chart’s x-axis, Renko charts are based only on price change. Depending on how much price action there is, a single Renko brick may take many days to create, while many bricks may form on another day.

Heiken Ashi Candlestick Indicators Analysis
Let’s examine the Heiken Ashi (HA) chart’s construction. Each Heikin Ashi candle’s open, close, high, and low calculated using four different methods.
The HA close represents the mean of the asset’s real high, low, open, and close prices for the specified time period.
4 divided by (High + Low + Open + Close)
The previous Heikin Ashi candle’s open and closure averaged to produce the HA open.
Preceding HA Open + Preceding HA Close) / 2
The highest of the three price levels is the HA candle high.
The price at the moment
Now, the HA open price
The current price of the HA close
The last of three price levels known as the HA low.
currently affordable
Now, the HA open price
The current price of the HA close
How to Use Heiken Ashi Candlestick Indicators?
Heikin Ashi is a type of chart, but it is also a technical indicator because it uses the Heikin Ashi formula to translate actual price levels of the underlying asset.
Prices on a Heikin Ashi chart will be different from those on a candlestick chart. A Heikin Ashi chart’s current price is the most recent determination of the HA closing price, as opposed to a candlestick chart’s current price, which indicates the most recent transaction or bid price. These figures can occasionally differ significantly.
Heiken Ashi frequently used by traders to assist smooth out price data and improve their ability to spot trading patterns like trends and reversals. The prices displayed on the chart, however, are frequently not transferable because the actual cost of an asset may vary. To obtain the best of both worlds—real-time data as well as confirmation and analysis—it is a good idea to keep an eye on both the actual price and the Heikin Ashi indication.
Using the Heiken Ashi Moving Average Method
By warning investors when the price is shifting, the Heikin Ashi generates its own trade signals. Red to green or green to red colour and direction changes used to accomplish this.
Red candles indicate a bearish trend whereas green candles indicate a bullish one in terms of buying pressure. By including a moving average indicator, it may be possible to filter these signals and limit trading to the direction of the stronger trend.
The accompanying silver daily chart now includes a 50-period SMA in addition to a 12-period SMA. As you can see, there are some trends that are smooth as well as some that are jagged, which the basic moving average line ignores.
Simple guidelines might have made it easier to profit from fads:
If the HA above the 50-SMA (with space between the HA and SMA) and the SMA is oriented upward, only buy when the HA changed from red to green during the last few candles.
Additionally, the 12-period SMA with separation must be above the Heikin Ashi.
Heiken Ashi Candlestick Indicators
When the HA changes from green to red, stop trading.
You may also get out when the HA closes below a shorter SMA, like the 12-period.
Only when the HA changed from green to red over the course of a few candles, the HA below the SMA (with some room in between), and the SMA tilted downward.
Additionally, the 12-period SMA with separation must be below the Heikin Ashi.
When the HA changes from red to green, stop trading.
Alternately, you might go out when the HA closes over a shorter SMA, such the 12-period.
Swing Trading with the Heikin Ashi
Any timeline used with Heikin Ashi charts. The chosen time period used in the calculation. Hourly, four-hour, or daily charts are frequently consulted by swing traders. The potential trading method mentioned above could be used with stocks, foreign exchange, commodities, or stock indexes. Let’s examine a another illustration, this time utilising an hourly stock index chart. Traders may search for a separation between the Heikin Ashi candles and SMAs if an asset is volatile.
Separation loses significance if the asset is less volatile, such as a stock index, because it happens less frequently.
swindling with Heikin Ashi
Scalping is a short-term trading method in which the trader enters and exits trades quickly, frequently several times each day. The most popular market for using this method is FX scalping. Heikin Ashi charts can be used on any timeframe, however scalping with them can present some challenges because they do not currently reflect the precise asset price. A formula is used to calculate the HA charts. Every cent, pip, and tick matters when trading quickly, therefore being aware of the precise price is crucial.
Patterns of Heiken Ashi Reversal
When the Heikin Ashi chart changes from red to green or from green to red, a short-term trend reversal pattern is formed. Reversal patterns that are larger may be more dependable. Heikin Ashi reversal patterns, such as head and shoulders, rounded bottoms, triple and double tops and bottoms, are the same as candlestick reversal chart patterns.
A reversal pattern can be traded exactly like a candlestick variation when it appears. An alternative is to utilise a moving average exit, like the one previously discussed, and get out of the trade when the price crosses a moving average (like the 50-period) in the opposite direction as the trade. A four-hour USD/CAD chart shows a head and shoulders reversal in the image below.
When the price moves below the head and shoulders reversal pattern, a short entry is made. When the price passes over the 50-period SMA or achieves the profit objective for a head and shoulders pattern, the trade is closed. The anticipated target for a head and shoulders pattern is the pattern’s height (about 1.37–1.35) less the breakout point (around 1.35), resulting in a target close to 1.33.
The Heikin Ashi Indication is Dependable, Right
Price oscillations can be tamed using Heikin Ashi charts and indicators, which makes it simpler to identify and trade patterns. However, the real price may differ significantly from what the most recent HA close indicates when a Heikin Ashi trade signal happens. Some trade signals may become obsolete as a result. For instance, a Heikin Ashi signal might advise buying a stock at $5, but the price might have gapped higher and is now trading at $7. The profitability of a possible trade may be eliminated if the spread between the trade signal and the actual price is too wide.
HA charts are challenging to use for determining stop-loss levels because they are based on average price movements.
In the strategy examples, a moving average trailing stop-loss or a colour shift on the HA chart were used. These may be effective, but the risk is not understood before the deal. By using a fixed stop-loss level, it is possible to manage risk. To do this, a standard candlestick chart must be consulted. In this manner, rather than using a HA average, which distorts where the price has actually been, the stop-loss can be set based on the price levels and patterns the price actually made.
Similar to every other technical indicator, Heikin Ashi has advantages and disadvantages that traders must be aware of in order to effectively use it in trading.

Visit us on: www.milliva.com


