What Does Tweezer Candlestick Pattern Tells About Forex Market
![]()
Technical analysis is vital. Not only for market timing, but also for assisting investors. In identifying market circumstances and adapting to the current market’s volatility. Chart patterns, such as the tweezer candlestick pattern top and bottom, are one of the most important aspects of technical analysis. Because they assist traders interpret market sentiment.
The tweezer top and bottom are combinations of several candlesticks. That signify a trend reversal at the end of an uptrend and downtrend, respectively. As a result, investors can more precisely buy and sell a asset. By analysing how these patterns show on a chart.
The next part contains a comprehensive trading instruction. Its for employing tweezer top and bottom candlestick patterns in the market. As well as a suggested buying and selling approach.
What Can we Learn from the Tweezer Top Candlestick Pattern?
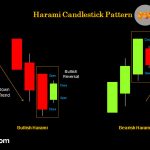
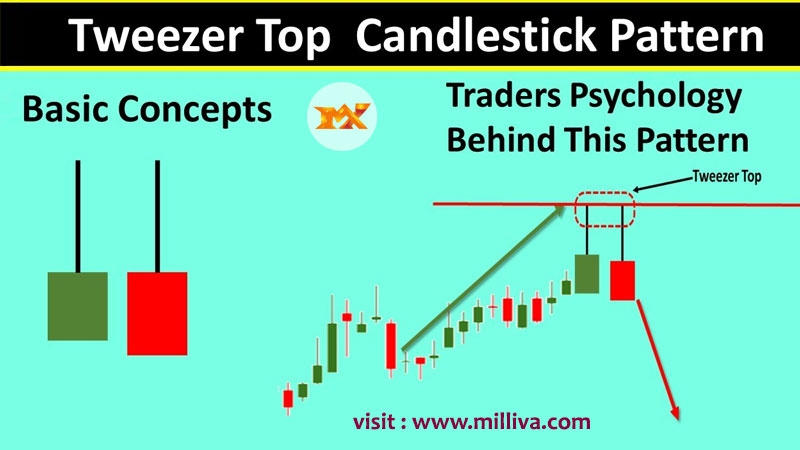
The prior trend is an uptrend when the Tweezer Top candlestick pattern is produced.A bullish candlestick appears, indicating that the current upswing will continue.The high of the second day’s bearish candle’s high suggests a resistance level the next day.
Bulls appear to be raising the price, but they are no longer prepared to buy at greater prices.The top-most candles with nearly identical highs highlight the resistance’s strength. And also indicate that the uptrend may be reversing to establish a downtrend.
The next day, when the bearish candle is formed, this bearish reversal is confirmed.
What is the Meaning of the Tweezer Bottom Candlestick Pattern?
The prior trend is a decline when the Tweezer Bottom candlestick pattern is established.A bearish tweezer candlestick appears, indicating that the current decline will continue.The second day’s bullish candle’s low signals a support level the next day.
The bottom-most candles with nearly identical lows show the strength of the support. And also imply that the downtrend may be reversing to build an uptrend.As a result, the bulls take action and push the price higher.
The next day, when the bullish candle is produced, this bullish reversal is confirmed.
The Pattern’s Importance
Tweezers that mimic the structure of a reversal candlestick pattern are particularly notable. The bearish engulfing pattern and dark-cloud cover (described below) are excellent examples of topping patterns.
A bullish engulfing pattern and a piercing pattern are critical to look for while looking for a bottoming pattern. Tweezers aren’t always visible on these candlesticks (similar highs and lows). When they do, the pattern gains even more significance.
Notable Reversal Pattern
A notable reversal pattern is a powerful rising bar followed by a hanging man or shooting star candle. Within the next couple of candles, the price should close below the genuine body of the second candle.
A strong down candle followed by a hammer would be an equivalent bottoming pattern. A closing above the hammer body on the third or fourth candle would create a solid case. That a short-term bottom has developed.
The hammer in Figure 3 isn’t perfect—the body might be a little smaller. And the peak could be a little closer. We can deduce that this is a potential turning point because it’s also a tweezer.
The price closes over the hammer two bars after the tweezers, indicating that the price is likely to continue higher in the short term.
How to Tell the Tweezer Tops and Bottoms
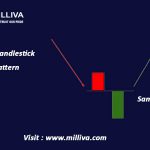
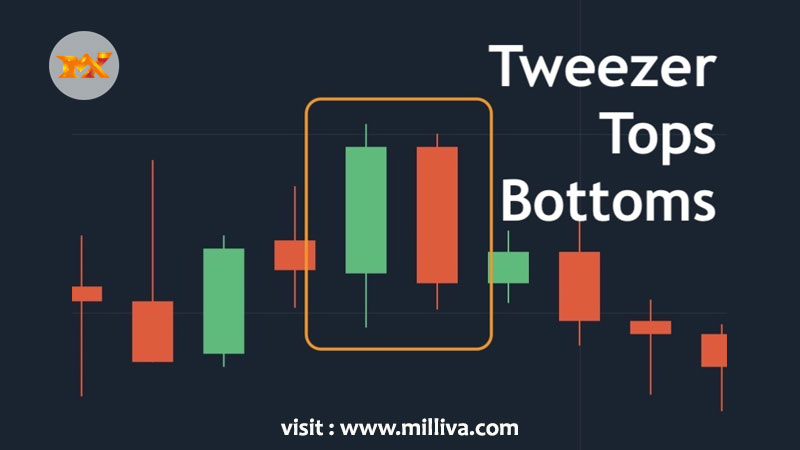
It’s simple to spot tweezer top and bottom patterns on a bare chart. Two long-bodied candlesticks occur in parallel but opposing directions in each rendition of the design.
The fundamental condition for using the tweezer trading strategy is to find a strong trend. Prices continue to rise when the market is rising. However, a bearish candlestick comes unexpectedly, similar to the most recent bullish candlestick, negating the bullish momentum. A tweezer top pattern, which indicates bearish pressure, looks like this.
In an uptrending market, the key technique to detect the tweezer top pattern is as seen above. In a downtrending market, the tweezer bottom pattern is the inverse of the tweezer top pattern. Price continues to fall when a bullish candlestick forms, which looks to be the same size as the previous bearish candle. A tweezer bottom occurs as a result, signalling a possible bullish trend.
In a downtrending market, the key approach to detect the tweezer bottom pattern is as seen above.
Let’s Have a Look at the Major Features of the Tweezer Top and Bottom Patterns
The first candle of the tweezer top is bullish, whereas the second candle is bearish.The high of the second candle should not be higher than the high of the first candle.The first candle of the tweezer bottom is bearish, whereas the second candle is bullish.The low of the second candle should not be higher than the low of the first candle.
Tweezer Patterns How to Trade Them
Because the tweezer candlestick is a reversal pattern, investors should determine the direction of the trend before entering a trade. Looking at swing levels might help you spot uptrending and downtrending markets. As a result, investors should understand how price charts produce higher highs and lower lows.
Let’s have a look at how to make a trade utilising the tweezer pattern step by step:
Tweezer Pattern Step by Step
Step 1: Once the market trend identified, investors can look for the point of interest area, which is the supply or demand zone from where the price has previously shown a strong reaction. As a result, investors should record key levels where a dramatic market reversal could occur.
Step 2: Identify the tweezer top from the resistance level and the tweezer bottom from the support level after you’ve found swing levels. Once the second candle has closed, double-check that the trade entry is still legitimate.
The tweezer bottom occurs near the support level in the preceding graphic, indicating a spectacular bullish reversal. Traders can enter the tweezer directly at the commencement of a new trend because it is a trend reversal approach. The tweezer might thus provide a better yield for a lower risk. The appropriate stop-loss level is below the bottom low of the tweezer (with some buffer).
The price climbs up and forms a tweezer top pattern at the resistance level in the upper daily LTC/USD chart. As a result, the price drops with a decent profit. The sell entry permits from the close of the second candle, and the stop-loss should be set above the high of the first candle.
Visit us on: www.milliva.com