What is Engulfing Pattern Candlestick in Forex Trading?

![]()
In the forex market, engulfing pattern candlestick are a useful way for traders. Who wants to enter the market. In anticipation of a possible trend reversal. The engulfing candle pattern, the trading environment that gives rise to the pattern. And how to trade engulfing candlesticks in forex are all covered in this article.
What is Engulfing Pattern Candlestick?
Engulfing candles usually indicate a reversal of the market’s current trend. This pattern uses two candles, with the latter candle engulfing the entire body of the candle before it. Depending on where it forms in relation to the existing trend, the engulfing candle can be bullish or bearish.
Is Engulfing a Bullish Pattern Candlestick?
Explained: Bullish Engulfing Candles
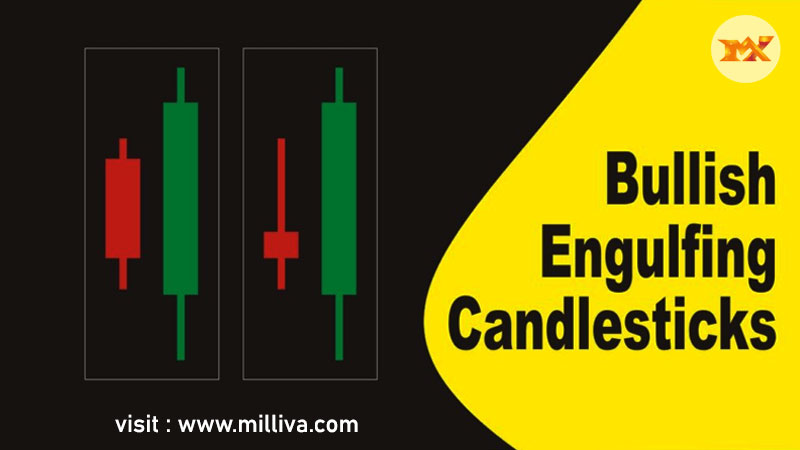
In a downtrend, a bullish engulfing pattern appears. The structure consist of small red candle and a much bigger green candle.
The first candlestick indicates bears control the market. Despite the fact that the second period begins lower than the first. New bullish pressure pushes the market price higher. Often to the point where the second candle is twice the size of the first.
What Can Traders Learn from Bullish Engulfing Candlesticks?
Following a bearish engulfing forex run, the bullish candlestick indicates that buyers have complete control of the market. It is frequently interpreter as a signal to buy the market. Which is going long – in order to profit from the market reversal. The bullish pattern is also a signal for short-term traders. Used to consider closing their positions.
The second candle in a bullish engulfing can provide a good indication. Where to place a stop-loss for a long position. Even though the wicks of the candles are not as important as the bodies for an engulfing pattern.
This is because it demonstrates. What the lowest price someone is willing to pay. For an asset at any given time. So, if the current uptrend reverses, your position will have a clear exit point.
When looking at a bullish engulfing pattern. It’s important to check the previous candles for confirmation. About price action and use technical analysis indicators to confirm the reversal.
An Illustration of a Bullish Engulfing Pattern.
The bullish engulfing pattern shows GBP/USD price chart. It has a green candle engulfing a previous red candle.
Although the red candle’s wick is longer than the green candle’s. The green candle’s body is nearly twice the size of its predecessor. Before a bearish reversal, the following seven days indicate a bullish trend.

Is Engulfing a Bearish Pattern Candlestick?
Explained: Bearish Engulfing Candles
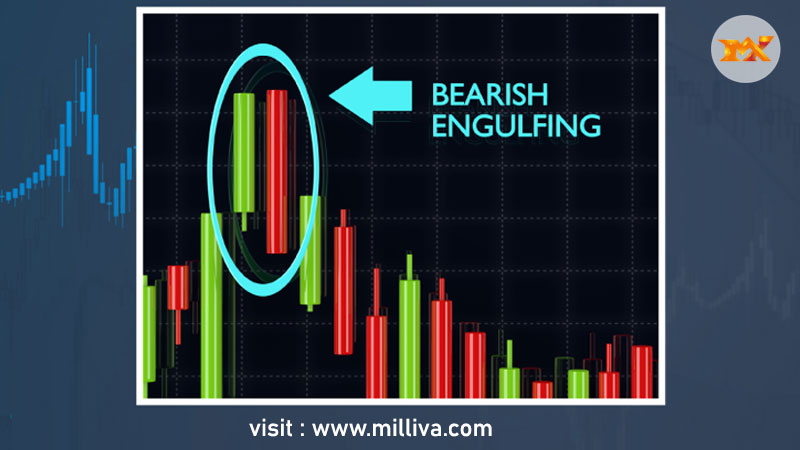
A bearish engulfing pattern is the polar opposite of a bullish engulfing pattern. It consists of a short green candle that is completely covered by a red candle.
The first candlestick indicates that bullish pressure. It is pushing the market price lower. While the second indicates that bearish pressure. Which is pushing the market price lower. The second period will start higher than the first. But will end much lower.
What Can Traders Learn from Bearish Engulfing Candlesticks?
Following a price increase. A bearish engulfing pattern indicates that the market is about to enter a downtrend. The reversal pattern indicates that bears have taken control of the market. And about to push prices even lower. It is frequently used as a signal to enter a short position or ‘short-sell’ the market.
The pattern can also be interpreted. As a signal for long-term traders to consider exiting their position.
Although the wicks aren’t considered a core part of the pattern. They can help you decide where to place your stop-loss. A stop-loss would be placed at the top of the red candle’s wick for a bearish engulfing pattern. This is the highest price the buyers were willing to pay for the asset before the downturn.
A Bearish Engulfing Pattern in Action
We can see an example of a bearish reversal on the USD/JPY chart below. The green candlestick represents the final bullish day of a gradual market upturn. While the red candlestick represents the beginning of a significant decline.
The second candle begins at a similar level, but it falls throughout the day, eventually closing much lower.
What Can You Learn from Bullish and Bearish Engulfing Patterns?
Engulfing candles aid traders in detecting trend reversals that signal trend continuation, as well as providing an exit signal:
1. Continuing the trend:
When a bullish engulfing pattern appears in an uptrend, it means the trend will continue.
2. Inversions:
Bullish and bearish scenarios are both possible. Engulfing patterns indicate a trend reversal.
At the bottom of a downtrend, a bullish engulfing pattern signals an uptrend reversal.
A bearish engulfing pattern found at the top of an uptrend, on the other hand, indicates a downtrend reversal.
3. Plan for Exit:
If the trader is holding a buying or selling position in an ongoing trend that is about to end. This pattern can also be used as a signal to exit.
You Can Begin Using Engulfing Candlesticks by
To practise trading in a risk-free environment. Open a demo account.
To put your technical analysis into practice. Open a live trading account.
In conclusion, The Bullish and Bearish Engulfing Patterns candlestick consists of two candles. The second of which engulfs the entire body of the first. Based on where it forms in relation to the current trend. The engulfing candlestick can be bullish or bearish.
When a bullish engulfing candle appears at the bottom of a downtrend. It signals a reversal of the trend and a rise in buying pressure. When it appears at the top of an uptrend. The bearish engulfing signals a reversal of the uptrend. It indicates a fall in prices by the sellers who exert selling pressure.
Engulfing candles aid traders in detecting trend reversals, which indicate trend continuation, as well as providing an exit signal.
Visit us on: www.milliva.com


