What is Donchian Indicator in Forex Trading
![]()
Donchian Indicator in Forex Trading are moving averages that use breakouts and retracements to detect prospective trends. The three channel lines that make up moving average calculations component of a technical indicator used in the financial markets to forecast price patterns for an asset, including uptrends and downtrends.
Richard Donchian, a renowned trader in the futures market, created the Donchian indicator in the 1950s to aid him in spotting trends in price charts. Donchian channels most frequently employed with candlestick charts because they provide an easy-to-read representation for traders.
The indicator tracks changes in a security’s price, like that of a currency pair, stock, or commodity, which can then result in trading alerts. Donchian channels sort of technical analysis used in trading where traders solely look at price action and historical data and disregard any fundamental variables that can affect an asset’s price. Continue reading to learn about trading with Donchian channels.
What is Donchian Indicator in Forex Trading?
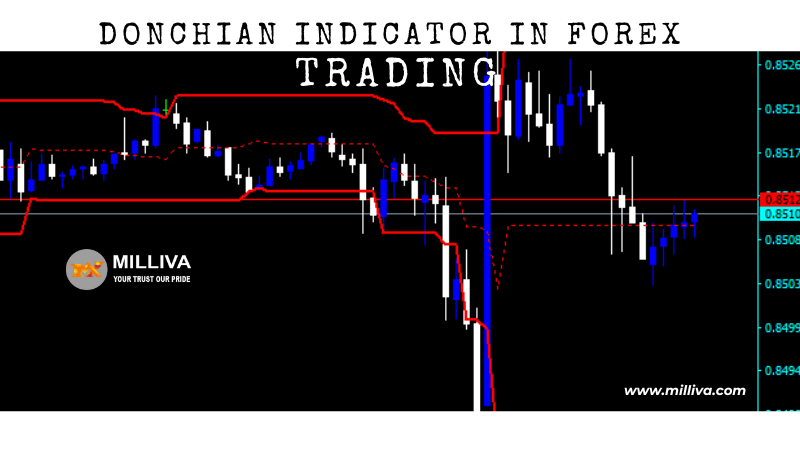
Three lines make up a Donchian channel: an upper band, a lower band, and a moving average in the middle. The moving average line depicts the median or average price that an asset moves between, while the upper and lower bands reflect the largest and lowest price increases and decreases, respectively. The timeframe used for this can be anything from a few minutes to a few months. As a result, traders can use Donchian channels to measure trends over the long and short term.
The Donchian indicator looks for correlations between an asset’s recent price and its historical price to determine whether there are bullish or bearish tendencies over a given time frame. The lower band reflects the lowest price an asset has ever attained during more difficult bearish reversals, while the upper band indicates the greatest price an asset has ever achieved, which is a sign of bullish energy.
Bollinger Bands vs. Donchian Channels
The Bollinger Bands are a technical indicator that, like Donchian channels, helps to record price movement in choppy markets over a predetermined period of time. Bollinger Bands, however, have a slightly different construction.
The centre line of the indicator, which also has three lines on a trading chart, represents the simple moving average (SMA) of the asset’s price. Bollinger Bands calculate the bands using the standard deviation as opposed to Donchian upper and lower channels, which use the highest highs and lowest lows as measurements. The SMA plus two standard deviations is the upper band, and the SMA minus two standard deviations is the lower band.
Here Is Formula for Donchian Indicator in Forex Trading
These straightforward calculations below used to calculate all three lines of the Donchian channels.
In this case, “N” stands for the length of time (in minutes, hours, days, or months) during which the Donchian channel is calculated. 20 days common benchmark used by traders when determining channel length.
Higher channel equals the greatest high in the preceding N times
Lowest low in the prior N periods was on the lower channel.
(((higher channel – lower channel) 2)) = middle line
When you open a position and use the Donchian indicator on your chart, our online trading software automatically calculates these calculations. Therefore, memorising these computations is not necessary, but it is a good idea to have a general grasp of how they operate.
How to Apply the Donchian Indicator in Forex Trading ?
Donchian channels generate trading indications after calculating the market’s momentum. The indicator enables traders to recognise market breakouts so they can capitalise on the trend as long as possible before it begins to wane. The market may be less volatile and show no obvious bearish or bullish trend if an asset’s price is moving nicely about the SMA line and does not enter either channel. However, there are two possible outcomes if the instrument deviates from the moving average line:
Traders may establish a long position and profit from the asset’s appreciation if the price advances toward the upper channel.
Traders may decide to open a short position and profit from the asset’s appreciation if the price swings toward the lower channel.
Donchian Breakaway Tactic
As was said before, traders can decide whether to open a long or short position based on the price divergence between channels. They can also decide whether to close their positions using a breakout strategy. For instance, the price of an asset may rise further after initiating a long position to trade on an uptrend until it reaches the upper band.
Many traders might decide to keep their long positions open if it succeeds in breaking through any further in order to ride the bullish trend.
A breakout, on the other hand, occurs when the price touches the upper band but fails to penetrate it. Traders may elect to close their positions and short sell as the price of the assets starts to decrease if they are unsure that the bullish trend will continue and instead forecast a bearish reversal coming. Sell signals are particularly prevalent in the stock market because of how erratic and volatile stock values are known to be.
Learn more about one of the most well-liked trading approaches in current market, shorting stocks, here.
How to use Donchian Indicator in Forex Trading?
To practise your Donchian channel method, sign up for a demo account. Using our customizable platform, select the market and asset you want to trade in and apply the indicator.
Analyze price movement to spot trading chances. Watch for price divergences from the simple moving average line for the asset. In order to spot a bullish or bearish trend, you might also watch for a breakout above or below the upper and lower bars.
Depending on the direction of the price, take a long or short position when entering the transaction.
A stop-loss order may be used by some traders in the event of false breakouts or trend reversals. In a market that is unstable, this can aid in preventing capital loss.
Sign up for a live account and deposit money when you are ready to trade with real money.
System of Donchian Trading
Through our online trading platform, Next Generation, traders can show breakouts, trendlines, and reversal trading methods. You can modify a variety of technical indicators, including Donchian channels, on our award-winning platform* to match your trading style and aesthetic preferences. A fully integrated mobile app for traders on the go, drawing tools, pattern recognition software, and a variety of chart styles are also available. Here is more information on our technical charting features.
MT4’s Donchian Indicator in Forex Trading
On our hosted platform, the globally renowned MetaTrader 4, Donchian channels are furthermore accessible for trading. The technical indicator, which displays price movement ranges and market volatility, is comparable to our own. Register for an MT4 account right now and view a complete range of MT4 indicators and add-ons to download for your individual trading account.

Visit us on: www.milliva.com