What Is Keltner Indicator In Forex Trading
![]()
Traders on the financial markets employ a type of technical analysis called the Keltner indicator in forex trading. It is a volatility-based indicator that displays price changes on advanced trading graphs as three distinct lines.
The direction of market trends predicted using Keltner channels, which will then produce trading signals. Since market circumstances are frequently unpredictable, traders utilise technical indicators to reduce their risk of financial loss. The Keltner channel trading method initially designed for the commodities market, but because of its effectiveness and simplicity used to a number of different financial sectors. This is true in especially for forex trading, but it also holds true for equities, cryptocurrencies, and readily accessible indexes.
This holds true not only for equities, cryptocurrencies, and indices that offered on our Next Generation trading platform but also for FX trading.
What does Keltner Indicator Forex Trading Mean?
Chester Keltner first proposed the Keltner technical indicator in the 1960s using a less complex formula. Instead of the average true range that now employed, it originally determined the width of the bands using only the simple moving average (SMA) and high-low price range. The current indicator, however, sets the distance using an exponential moving average (EMA) rather than a simple moving average (SMA). The upper and lower bands calculated using the average true range (ATR), an independent volatility-based measure.
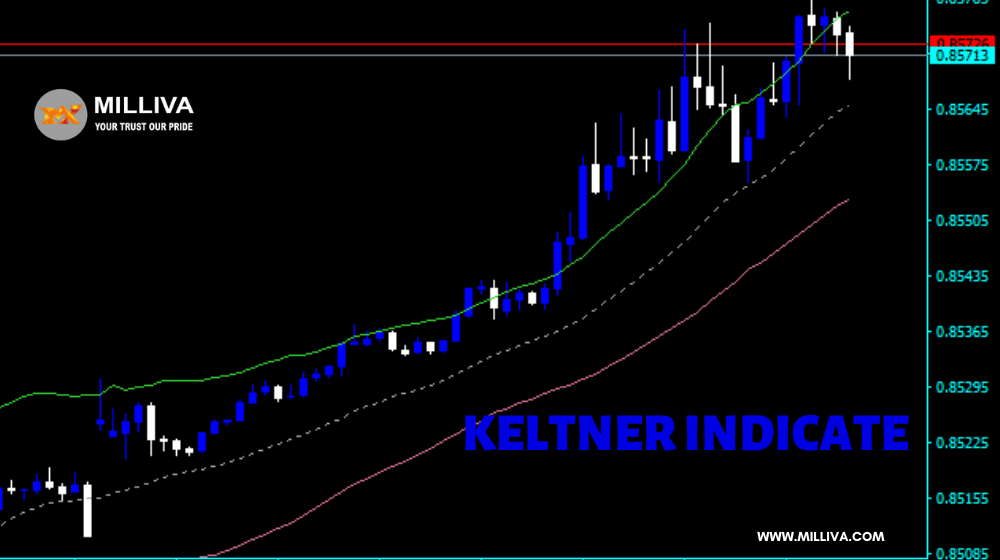
The channels usually configured to have two ATR values above and below a 20-day EMA. Although it is not as volatile as other indicators, such as Bollinger Bands, the channels might expand and shrink in response to an asset’s volatility. The three lines with the EMA in the middle can be seen in the figure below. When a trader plans to enter or maintain a position, these aid in illustrating lines of support and resistance. An asset’s price may swing between the upper and lower bands. The trader can think of the upper channel as support and the bottom channel as resistance.
The price movement typically falls within the upper channel during an uptrend (as depicted in the illustration for Gold), but during a decline, it typically does so within the bottom channel.
Bollinger Bands Against Keltner Indicator in Forex Trading
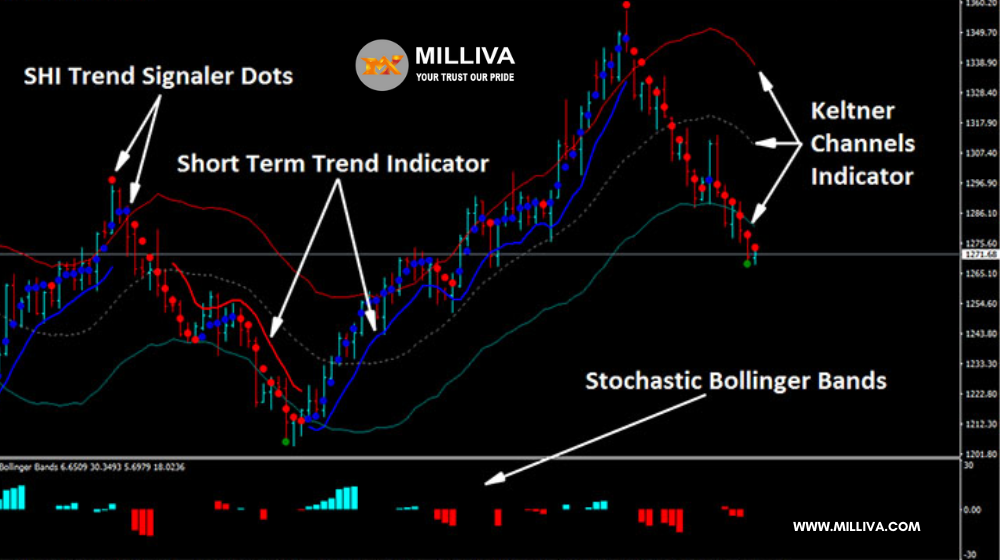
Advanced technical analysis techniques like Bollinger Bands and Keltner Indicator in Forex Trading are used to find possible trade opportunities in both bullish and negative markets. A very comparable technical analysis technique, Bollinger Bands, helps to illustrate market trends and whether an instrument’s typical price is high or low in relation to other prices.
The band parameters are the primary distinction between Bollinger Bands and Keltner Indicator in Forex Trading. On price charts, Bollinger Bands also show three lines, with the middle line serving as a moving average.
Bollinger Bands employ standard deviation to determine the upper and lower bands, whereas Keltner Indicator in Forex Trading use the ATR indicator. Due to the tiny variations in the algorithms, trading signals may also vary between indicators.
Formula for Keltner Indicator in Forex Trading
When the EMA is normally over 20 periods and the ATR is typically over 10 or 20 periods, the following method can be used to calculate Keltner Indicator in Forex Trading:
Middle line = Exponential moving average (EMA)
Upper channel band = EMA + (2xATR)
Lower channel band = EMA – (2xATR)
The Keltner channel formula
Based on the trading asset, you can change the Keltner channel computations. For instance, it could differ from a pure 2.0 multiplier. Wider channels result from greater multipliers, and vice versa. Since Keltner channels measure price trends, this means that an asset’s price may exceed the top band or fall outside the lower band, whereas it should remain inside the channels for best outcomes.
If traders disregard the rules, Keltner channel computations could be wrong. In this scenario, traders should alter the multiplier so that the price settles inside the channels’ width.
As a result, the Keltner indicator will provide more precise information.
How to use Keltner Channels for Trading?
The FX market frequently employs Keltner channels. Because of how volatile forex trading may be, Keltner channels can be used to determine whether an instrument is now overbought or oversold. We shall discuss day trading and scalping, two of the most popular forex trading techniques, below.
Day Trading Method Keltner
Short-term tactics like day trading allow forex traders to profit from minute price changes. Let’s look at an instance of day trading employing a Keltner channel trading approach.
In order to capitalise on currency volatility, this trading technique entails opening a position to trade on the price movements of currency pairings with the intention of closing the position before the end of the trading day. The basic function of Keltner channels is to frame prices inside trading charts. Therefore, Keltner channels indicate the precise lines of support and resistance that the market will follow, reach, and possibly surpass, as opposed to other forex indicators that merely display strength and weakness and require guesswork as to which way the market will move.
Short-term day traders will find this to be very helpful since they must maintain focus and react swiftly to fluctuations in the market. By monitoring price charts with Keltner channels, day traders may be able to create an entry and exit plan for their open positions that is more effective. This is also true when employing Keltner channels to scalp in the currency market.
Strategy for Scalping Keltner Channels
Although the positions are held for a lot less time, with some only lasting for seconds or minutes, forex scalping is similar to a day trading method. As a result, while trading currency pairs, some traders opt to prepare an even speedier entry and exit strategy. In addition to finding breakouts and pullbacks in the charts, scalping with Keltner channels enables traders to notice trend reversals if the market is in an especially turbulent state. This encourages traders to abandon positions if they notice that the markets are moving unfavourably (beyond the lower channel bands), which can reduce their chances of losing money.
Scalping in general is a method for traders with a high level of experience and can bring many hazards, despite the fact that Keltner channel scalping tactics have shown to be quite effective. To minimise the loss of capital, it is crucial to appropriately manage your risk using execution tools like stop-loss orders. For scalping, read more here about risk and money management.

Visit us on: www.milliva.com